Poll Shows More Parents Think Their Kids Are Progressing Well Academically
As another month passes, so too does more K-12 education legislation. Florida Governor Ron DeSantis recently signed a bill to expand school choice in Florida to include every student in the state. This bill makes Florida the fourth state in 2023 to pass universal school choice legislation, joining Iowa, Utah, and Arkansas.
As for the rest of the country, students and families are closing the book on a well-earned spring break and are looking toward the homestretch of the 2022-2023 academic year. How do parents feel about their child’s progress so far? Which of lessons learned in this school year can be carried into the next?
In partnership with Morning Consult, EdChoice surveyed a nationally representative sample of American adults 18 and older (N=2,110) from March 15-16, 2023. With additional sampling, we obtained responses from 1,029 parents of children currently in K-12 education.
We did not include any new questions this month. However, we observed some fascinating data points in relation to our longstanding questions on the direction of K-12 education, tutoring, and microschools. The full report can be found here. Here are the key takeaways:
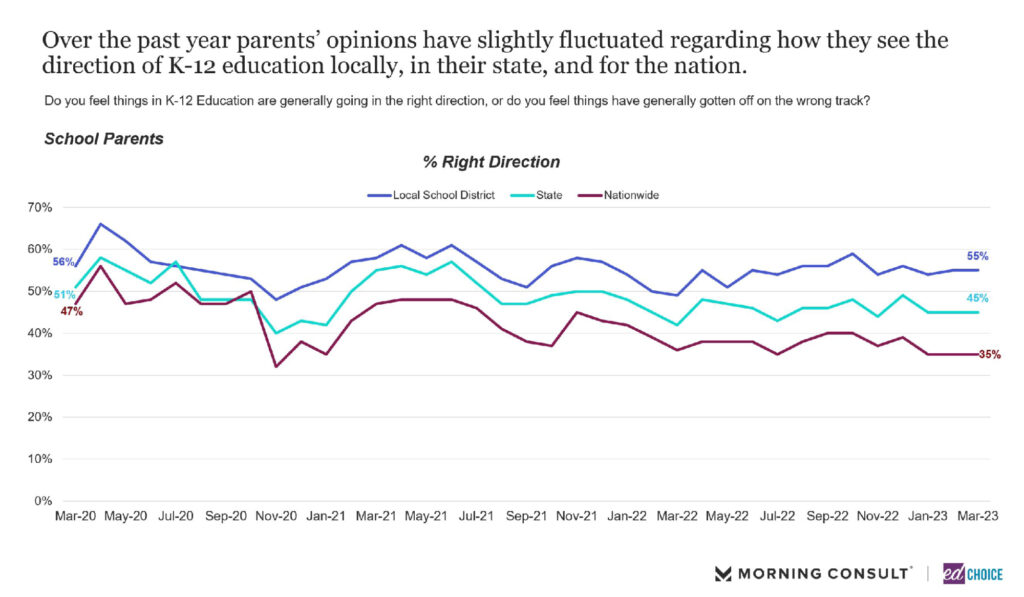
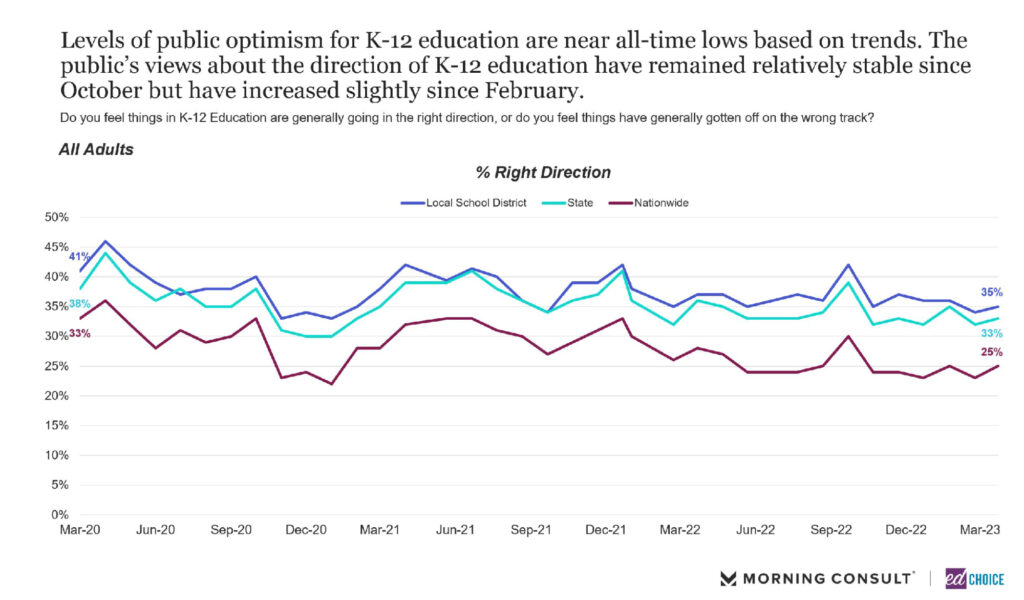
1. Parents’ optimism about the direction of K-12 education is unchanged from February. The shares of parents who feel that K-12 education is going in the right direction on the local, state, and national levels round to the same totals in March that we saw in February. As usual, parents are more optimistic than the general public, and they are most optimistic about education locally and least optimistic about education nationally.
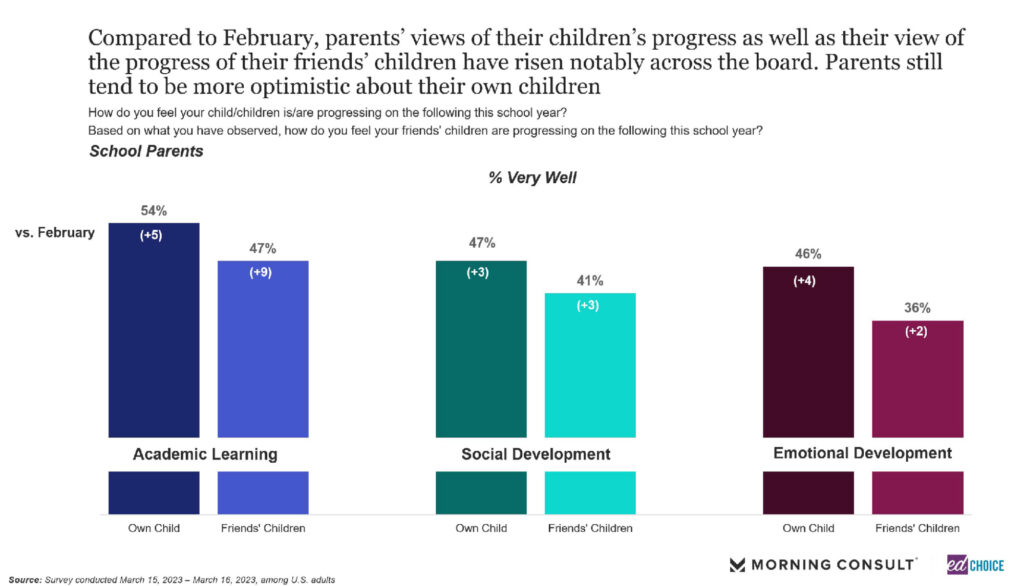
2. Parents’ belief in their child’s progress increased slightly in March. For the first time in 2023, more than half of parents believe their child is progressing very well when it comes to academic learning (54%). Parents remain somewhat less likely to be as optimistic about their child’s social (47%) or emotional (46%) development. While parents still are noticeably less likely to say their friends’ children are progressing very well than they are about their own children, the share of parents who were very optimistic about their friends’ children’s academic development jumped nine percentage points from February to March.
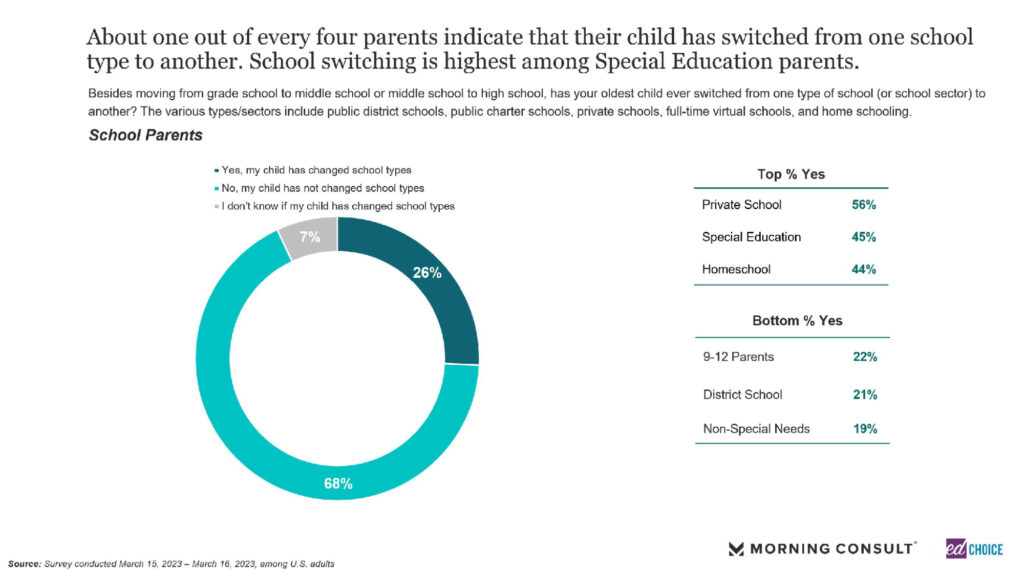
3. About one in four parents report their child has switched school types. We posed the following to parents: “besides moving from elementary to middle school or middle school to high school, has your child has ever switched from one school type to another?” Roughly a quarter of parents (26%) indicated that their child has switched schools. Parents of special needs children were especially likely to say they have switched their child’s school type (45%), while parents with no special kids were the least likely of all groups to have switched their child’s school.
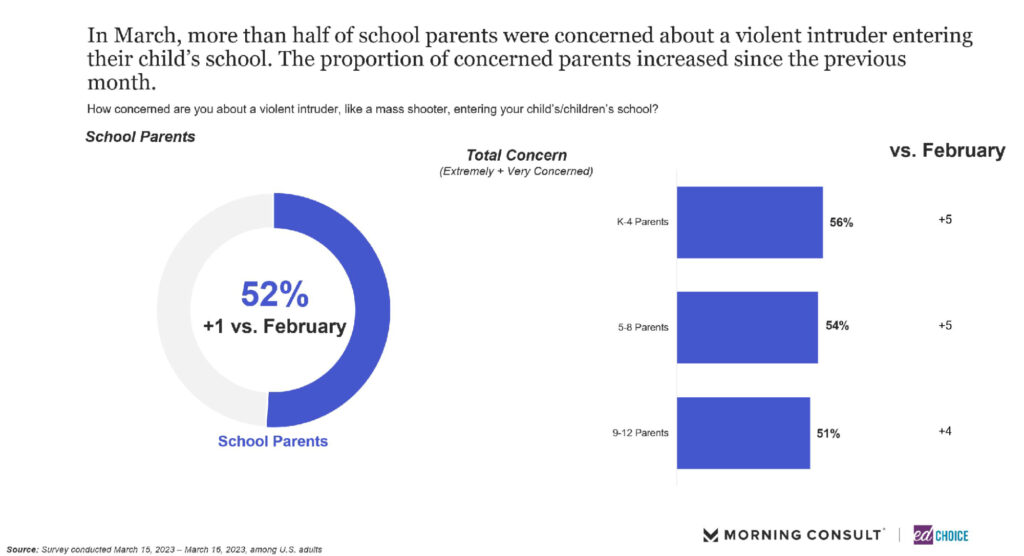
4. School safety concerns among parents remained high in March. As stated earlier, this survey was in the field March 15-16. The tragic school shooting in Nashville took place than two weeks later, on March 27. Even without that priming, more than half of parents are “extremely” or “very” concerned about the possibility of a violent intruder entering their child’s school (52%). While this percentage has hovered around half since we began asking this question last summer, the share of parents who are at least “very concerned” about a shooting in their child’s school has risen eight percentage points since December. Parents of younger children are the most likely to be concerned about a violent intruder (56%), up 5 points from February. Parents of children in grades 5-8 (54%) and parents of high school students (51%) also showed slightly increased levels of concern, up 5 points and 4 points from February, respectively.
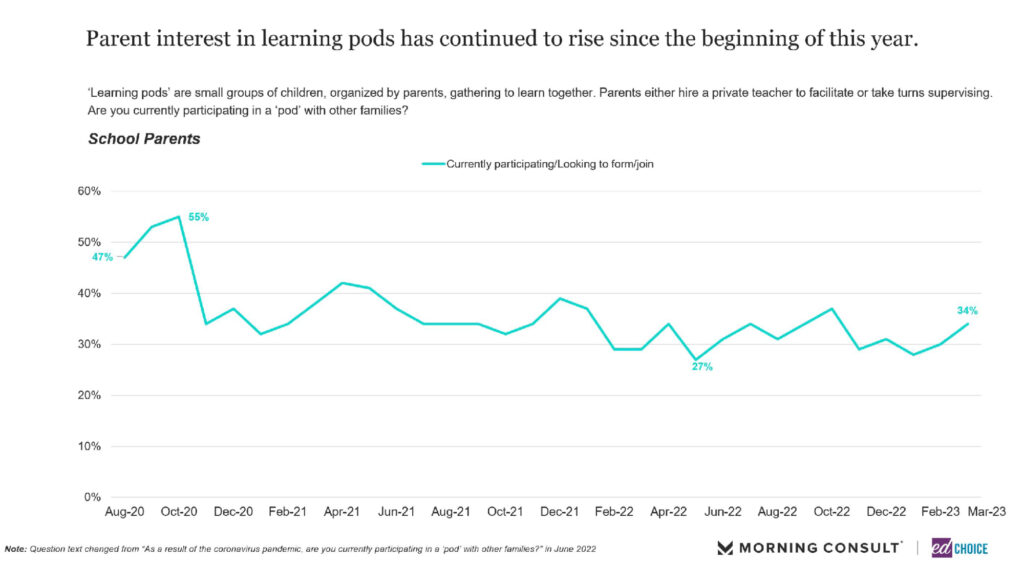
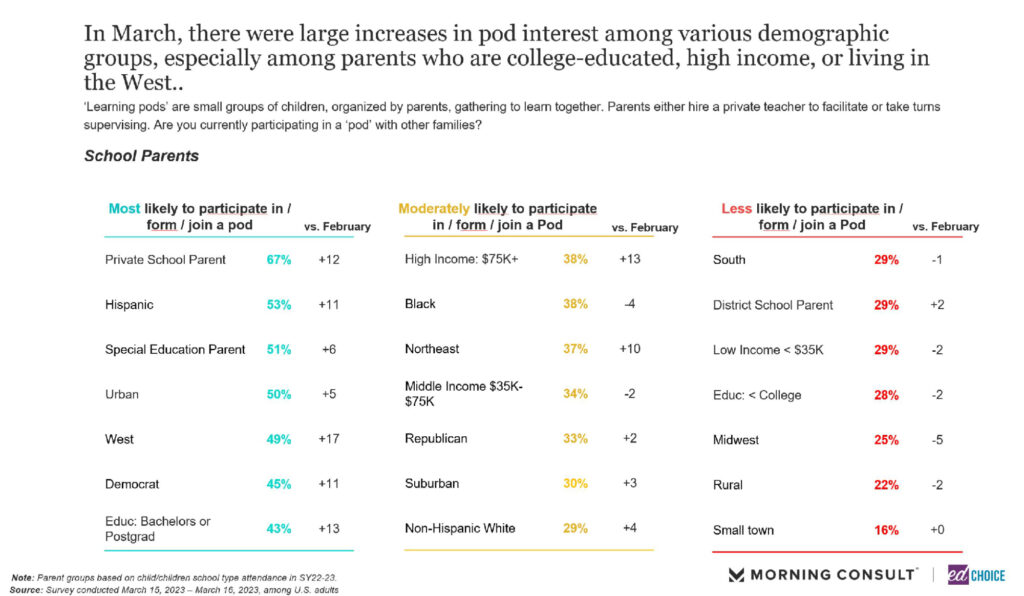
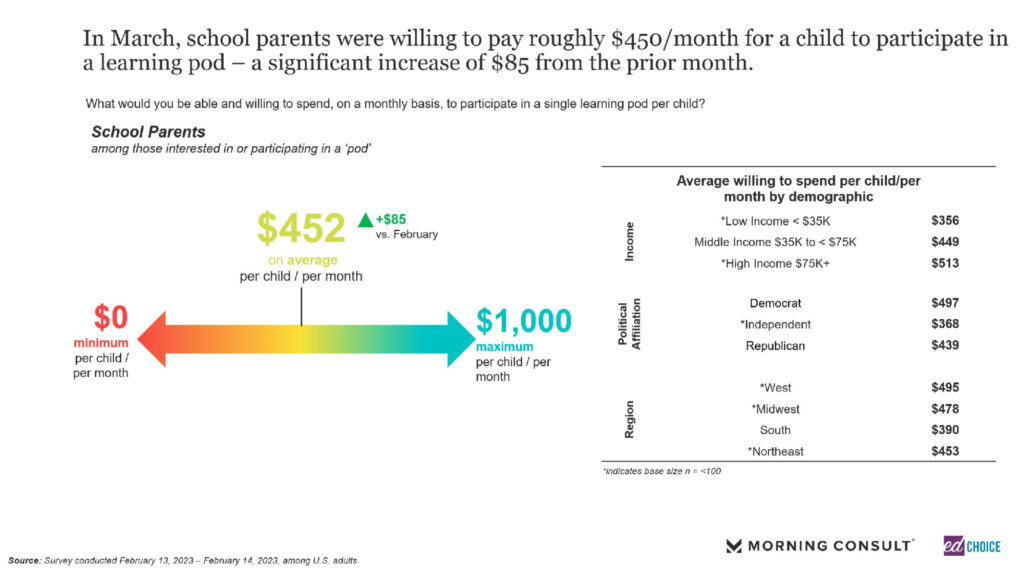
5. Support for learning pods continues to grow. About a third of parents reported participating in, or seeking to join, a learning pod in March. This is an increase of four percentage -points jump from February. This is the highest percentage of parents using or interested in learning pods since October. Examining costs associated with learning pods provided further proof of parents’ seriousness towards the idea. On average, parents reported being willing to spend $452 monthly per child. This is a significant increase from February, when parents indicated they were willing to spend roughly $370 per month, on average, towards putting their child in a learning pod. Some parent groups were more likely than not to indicate that they were in or interested in learning pods. Private school parents (67%), Hispanic parents (53%), parents of children with special needs (51%), and parents of urban areas. Parents in non-urban areas were least likely to participate in or be interested in a pod (rural 22%, small town 16%).
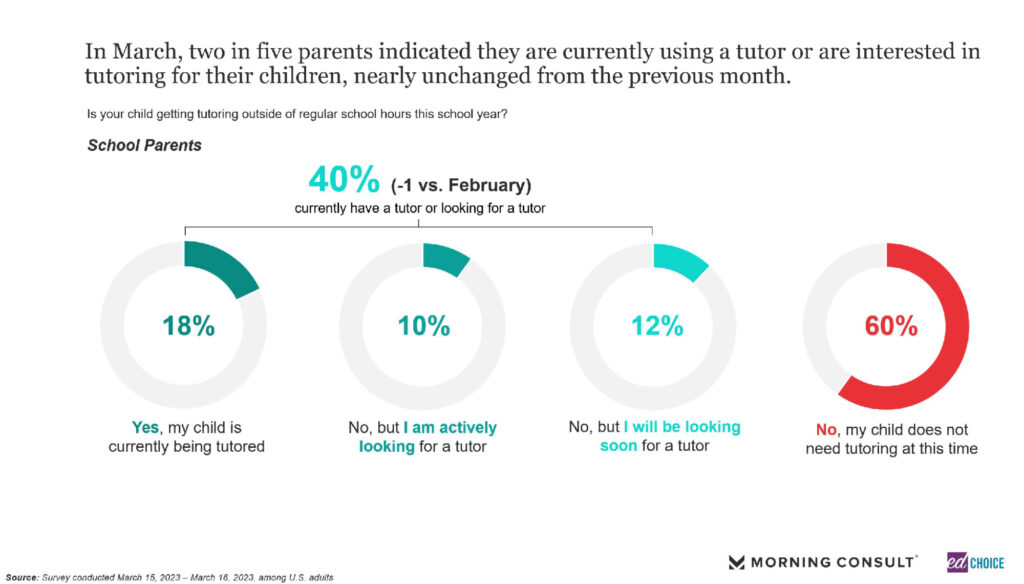
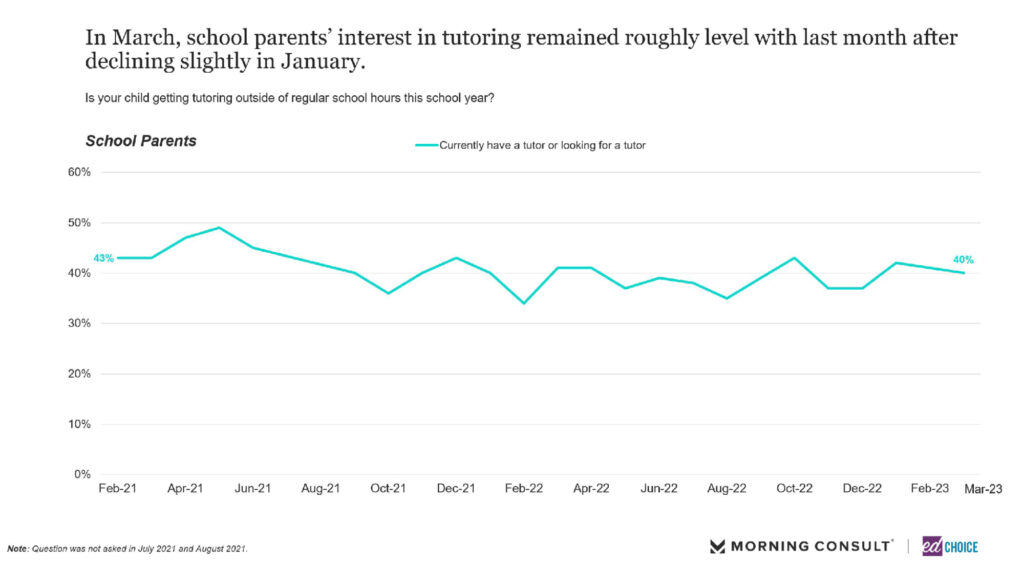
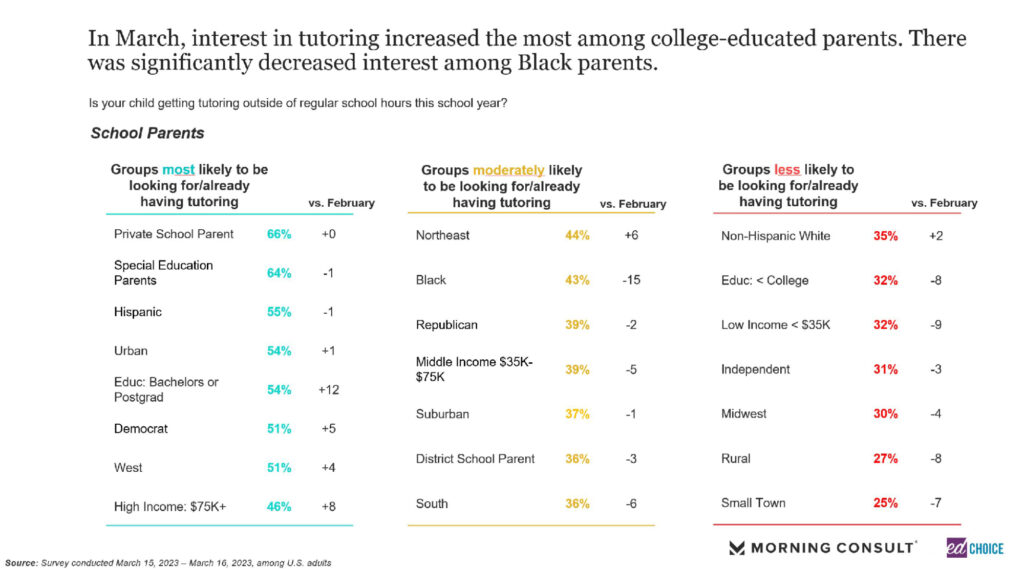
6. Tutoring interest remains stable. For the third consecutive month, about two out of four parents said their child was receiving, or would like them to receive, tutoring outside of regular school hours. Furthermore, parents were willing to pay more for tutoring in March. On average, parents reported being willing to pay $381 a month for tutoring for their child. This is an increase of $84 since February, as well as being the highest average amount we’ve observed since January 2022. As with learning pods, the three groups most likely to have tutoring for a child or interested in doing so were private school parents (66%), special education parents (64%), Hispanic parents (55%), and parents in urban areas (54%). Parents in rural areas and small towns were least likely to have or be interested in tutoring (27% and 25%, respectively).
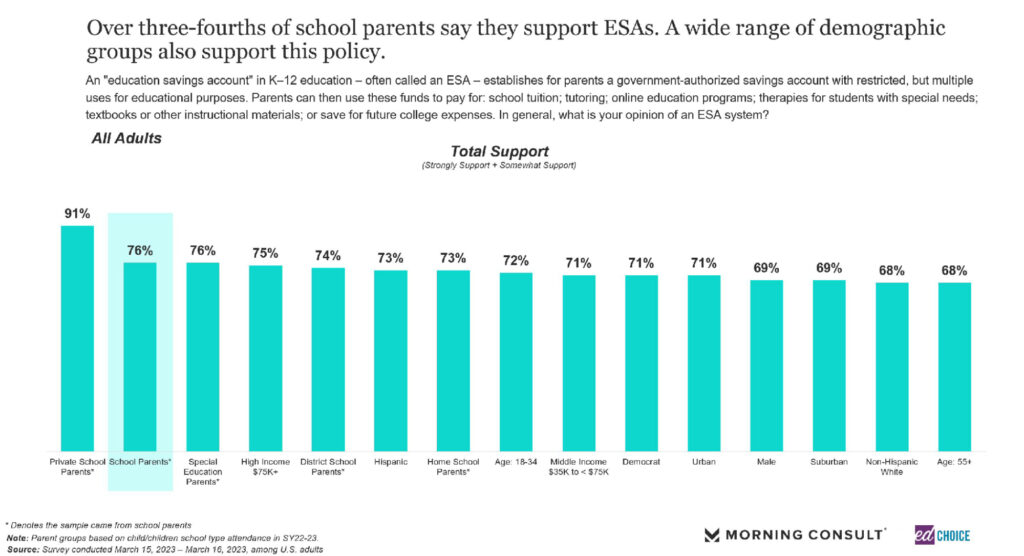
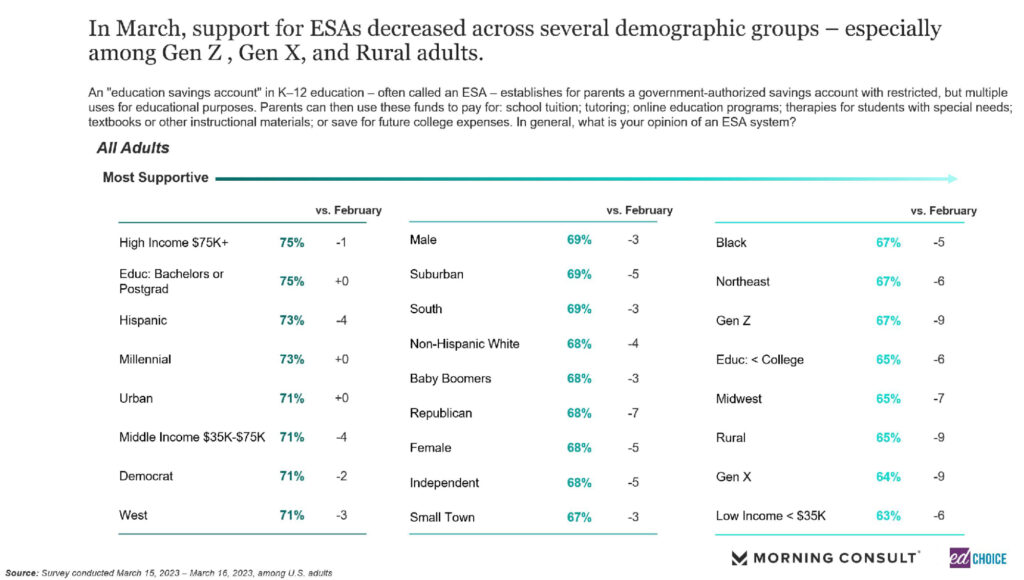
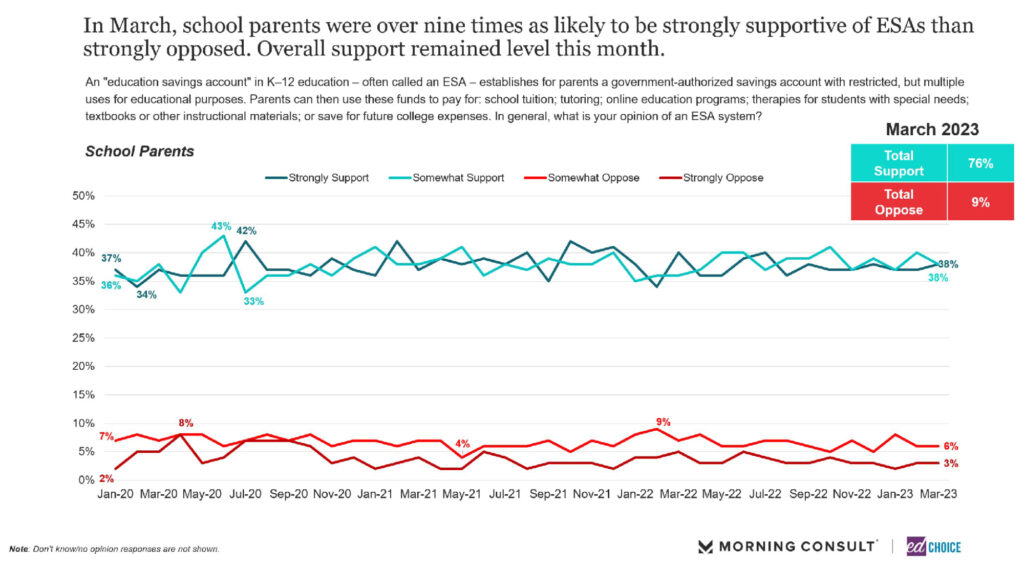
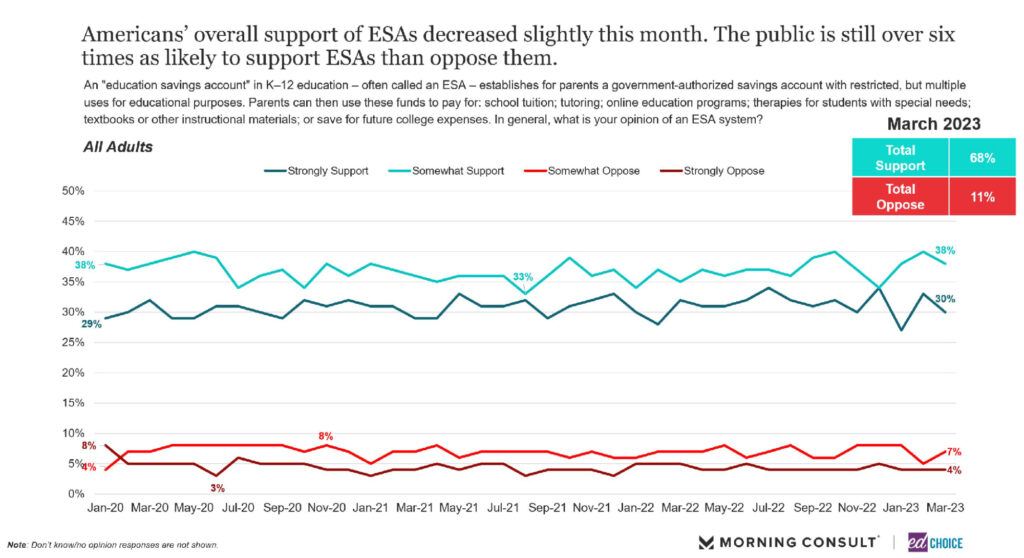
7. More than three-fourths of parents are favorable towards Education Savings Accounts (ESAs). Support for school choice policies dipped slightly in March, although the majority of Americans are still favorable of each of the policies. ESAs remain the most popular policy with 68 percent support among the general population. Demographic groups indicating above-average support for ESAs include parents (including parents of children attending public district schools), Hispanic respondents, high- and middle-income respondents, Black respondents, Democrats, and respondents from urban areas.
Visit the EdChoice Public Opinion Tracker site to access past reports, crosstabs, and questionnaires. We update our national and state dashboards every month. We also provide a more in-depth description of our research and survey methods.
Our K–12 education polls archive is updated on a rolling basis, roughly a few times each month. Please don’t hesitate to let us know if we are missing any surveys, or if there are accidental errors.


