Survey Finds Parents Supportive of a Four Day School Week
As the curtains close on another school year, parents are intrigued by the possibility of a four-day school week according to a new, national survey by EdChoice.
In partnership with Morning Consult, EdChoice surveyed a nationally representative sample of American adults 18 and older (N=2,259) from May 17-19, 2023. With additional sampling, we obtained responses from 1,271 parents of children currently in K-12 education.
We included several new questions about the recent National Assessment of Educational Progress (NAEP) results. The survey also explored opinions on four-day school weeks. Access the full report here.
Here are some of the key takeaways:
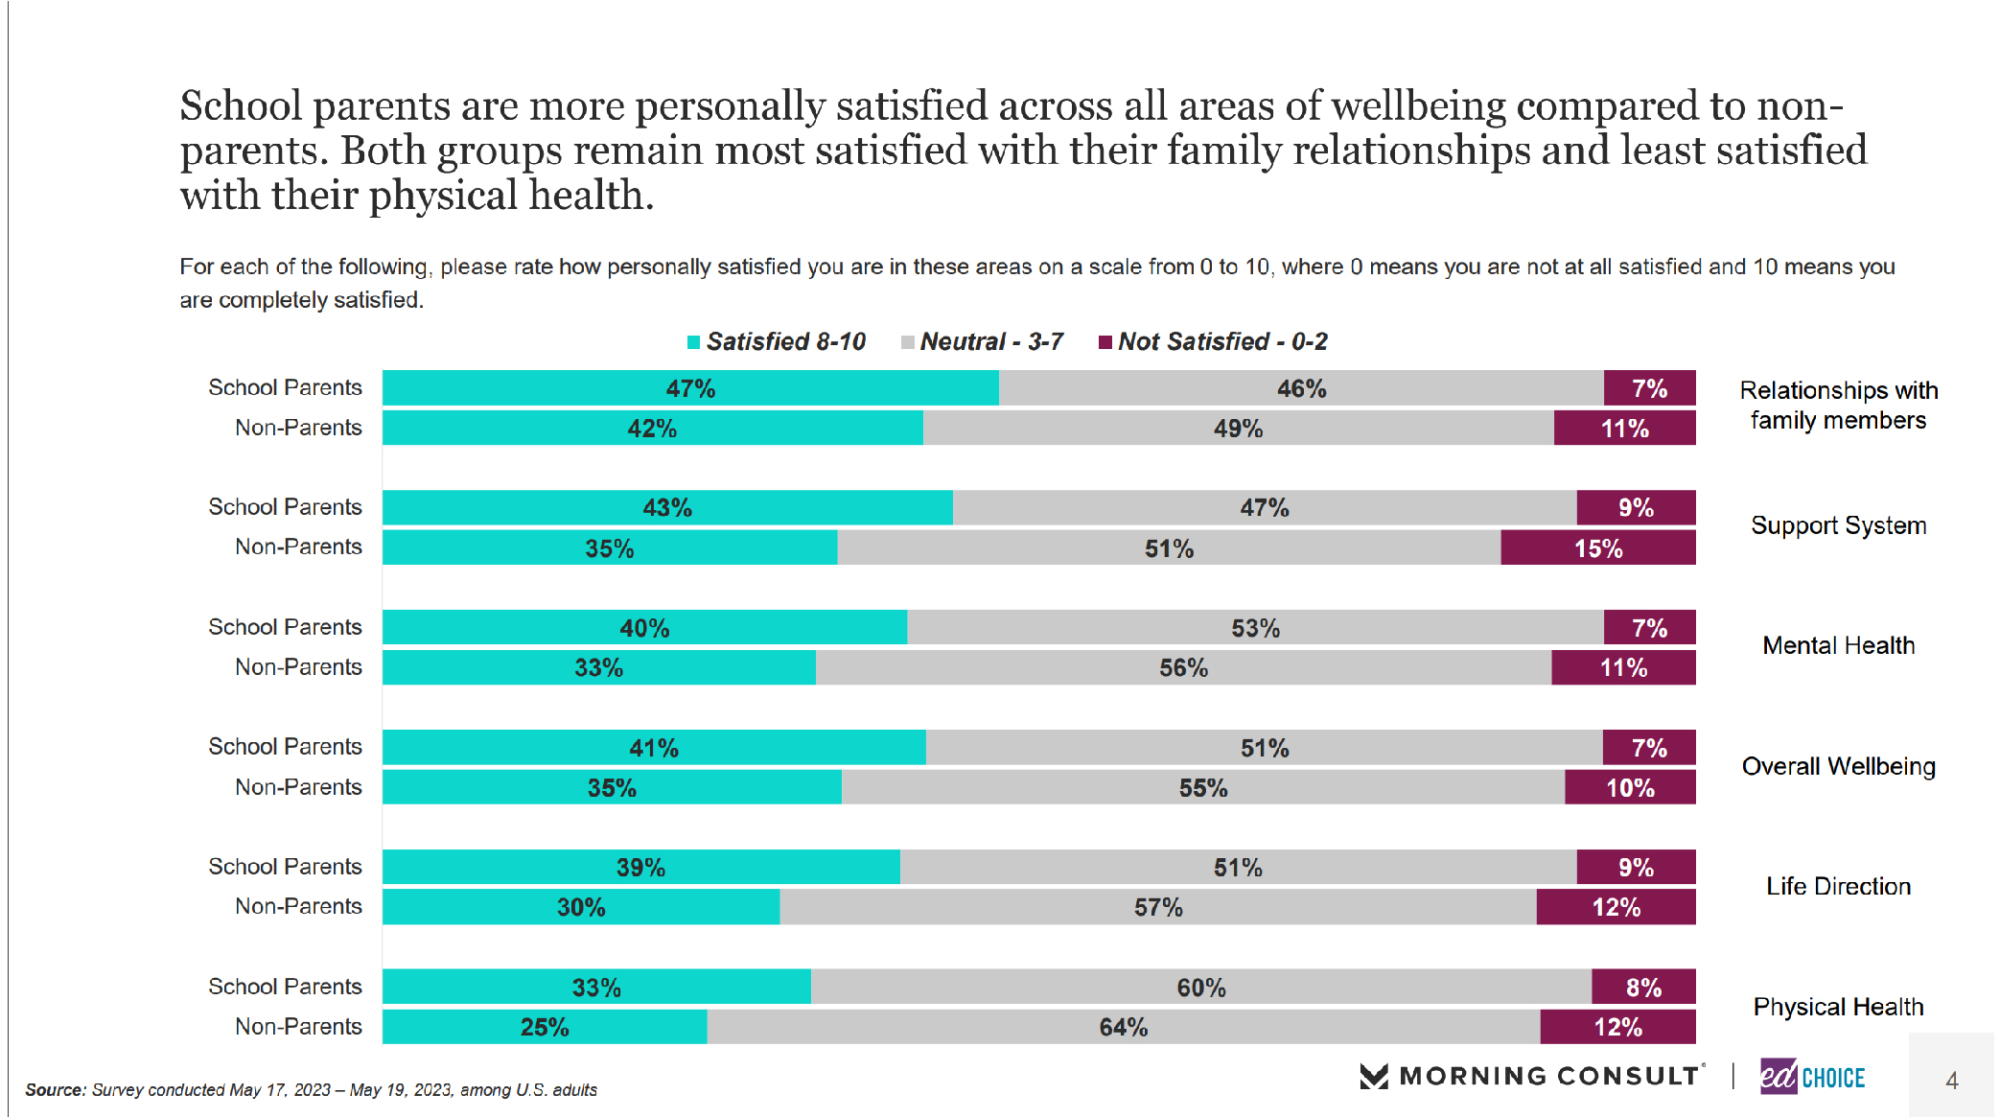
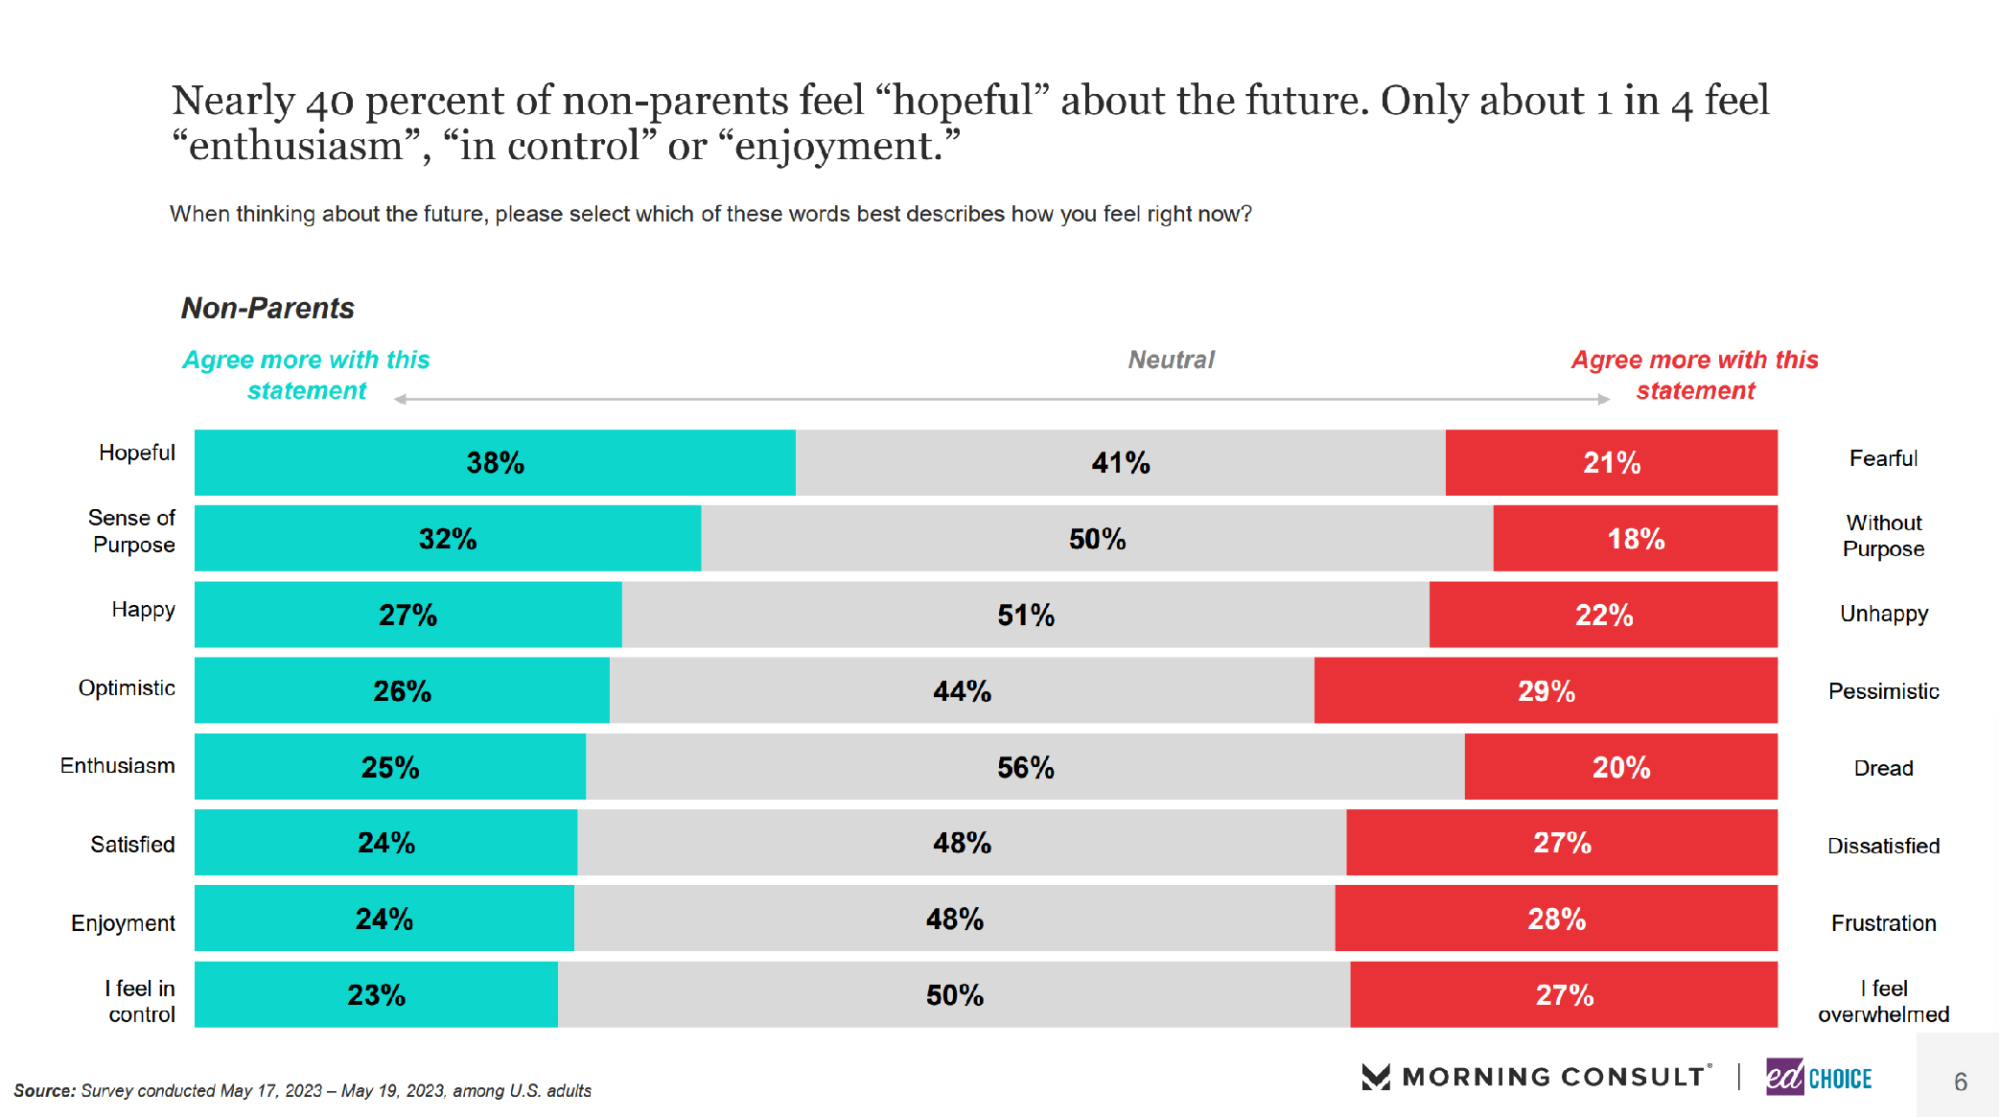
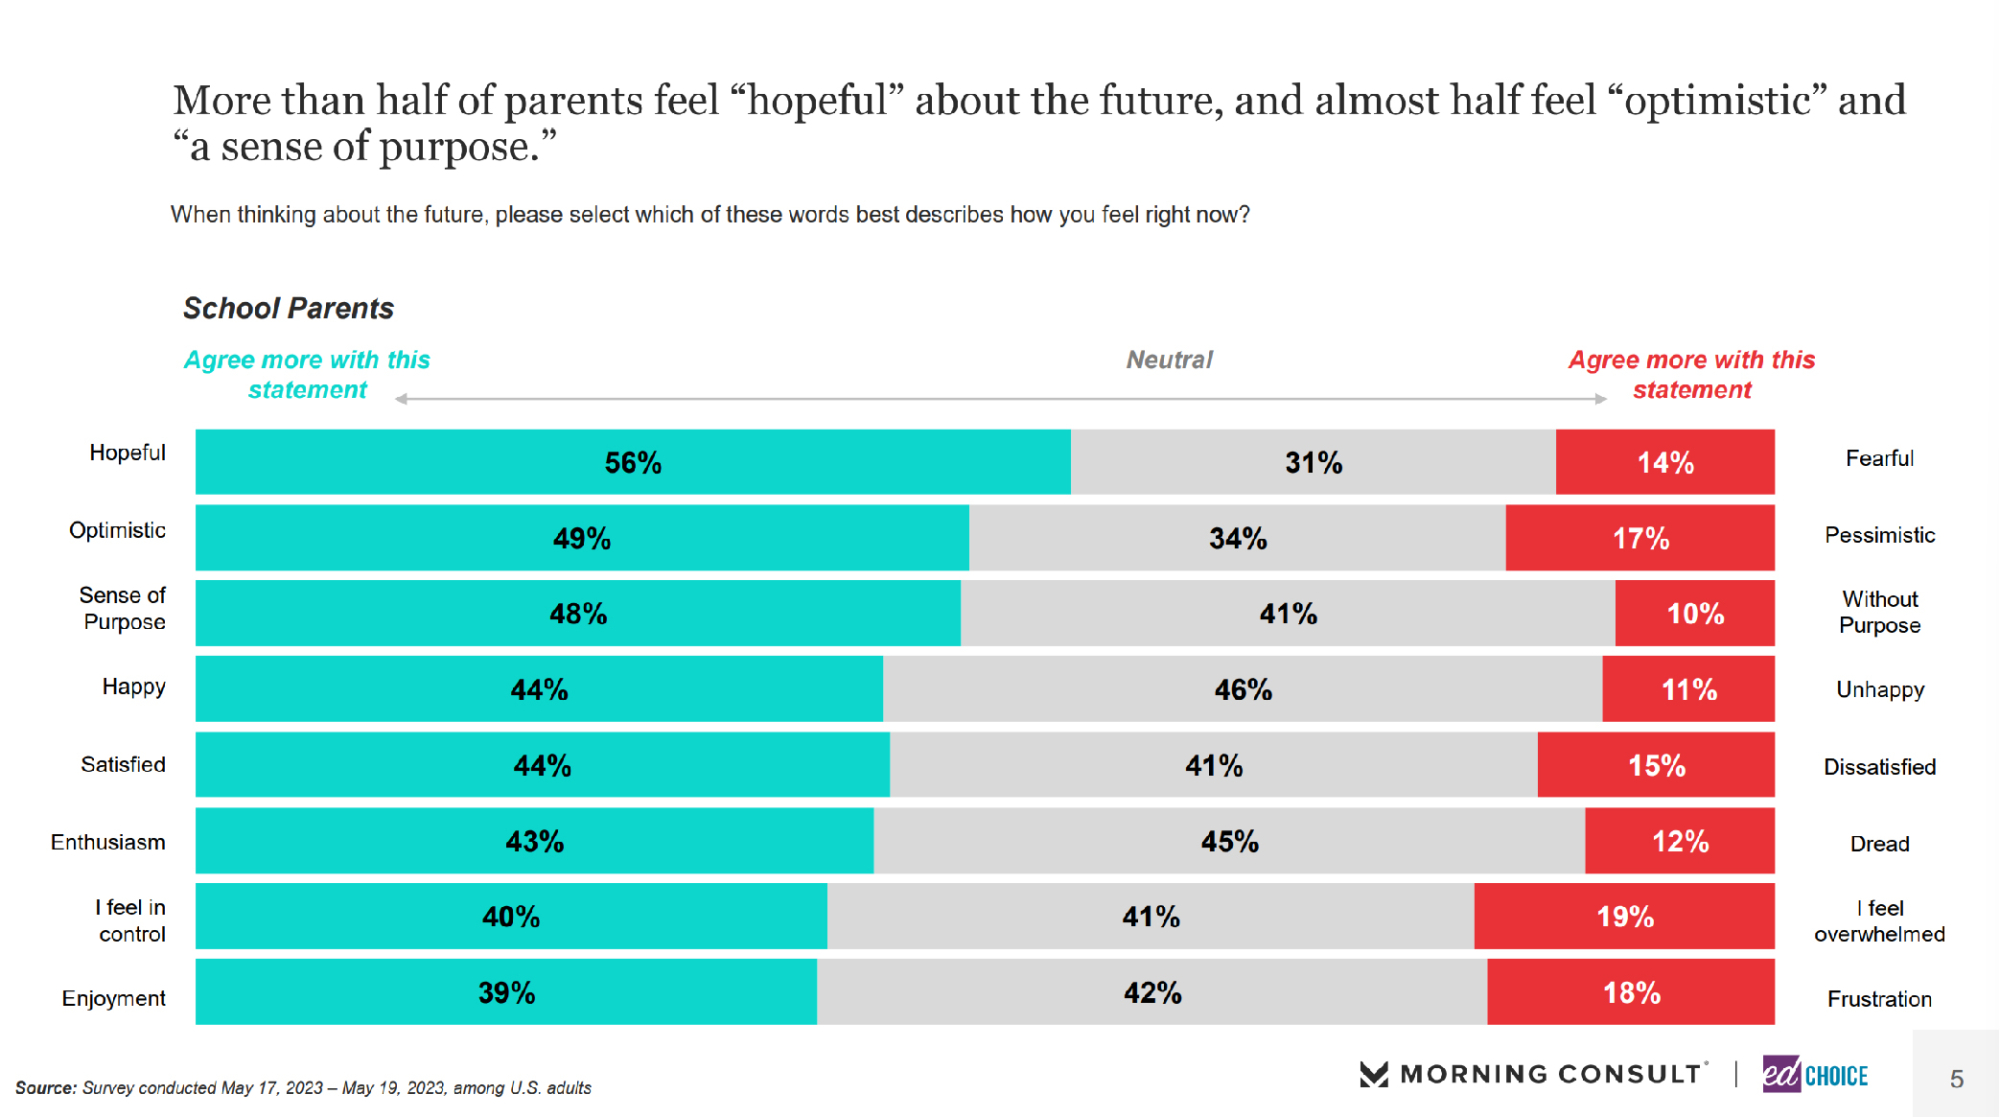
1. Parents report higher levels of happiness and wellbeing than non-parents. We asked respondents several questions pertaining to their wellbeing and happiness. First, examining satisfaction levels in different areas revealed parents are more satisfied than non-parents. Parents are more satisfied than non-parents in important areas like relationships with family members (+5), mental health (+7), overall wellbeing (+8), and life direction (+9). When thinking about the future, parents are much more likely to feel hopeful (+18), happy (+17), and in control (+17) compared to non-parents.
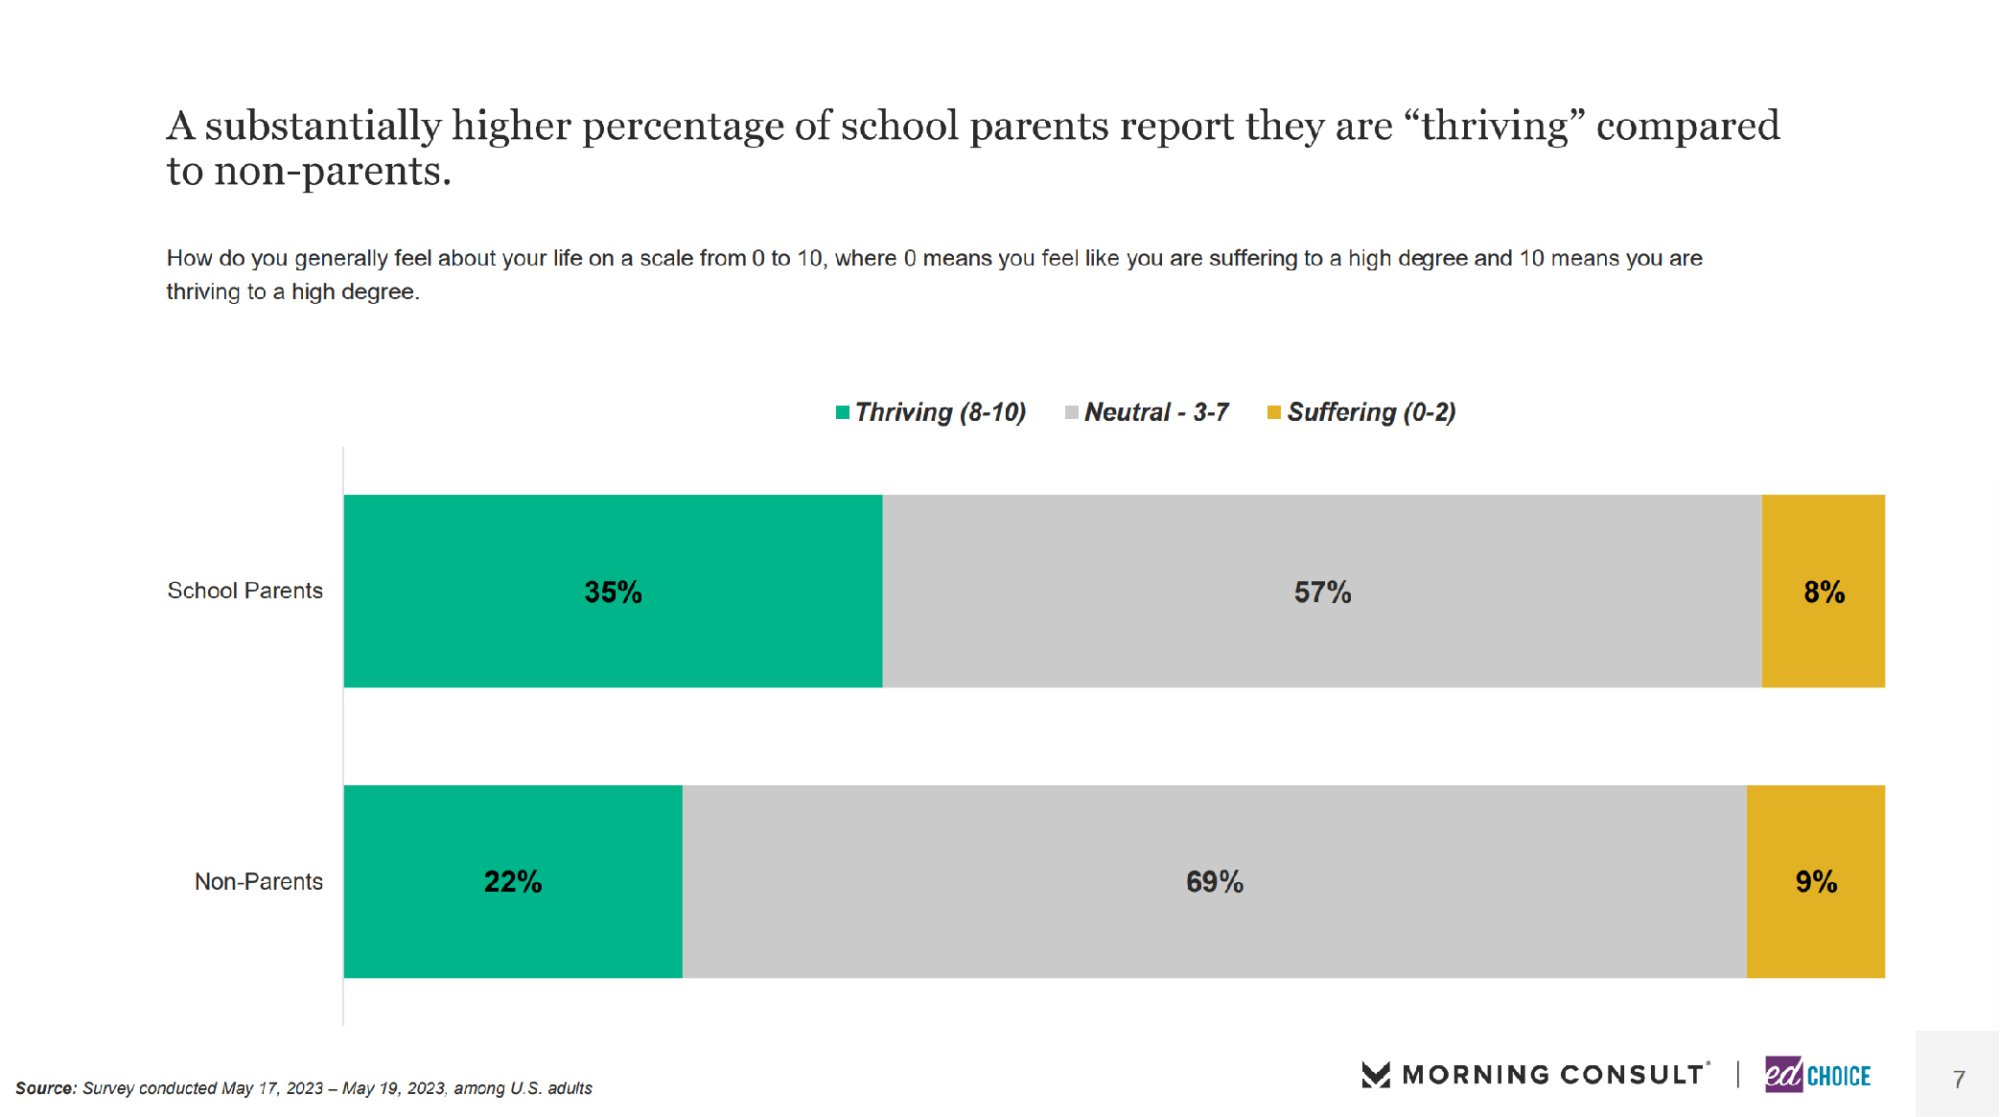
A higher percentage of school parents report they are “thriving” compared to nonparents. We posed this question to parents and the general public, “How do you generally feel about your life on a scale from 0 to 10, where 0 means you feel like you are suffering to a high degree and 10 means you are thriving to a high degree.” More than one-third of school parents (35%) said they are thriving, compared to 22 percent of nonparents.
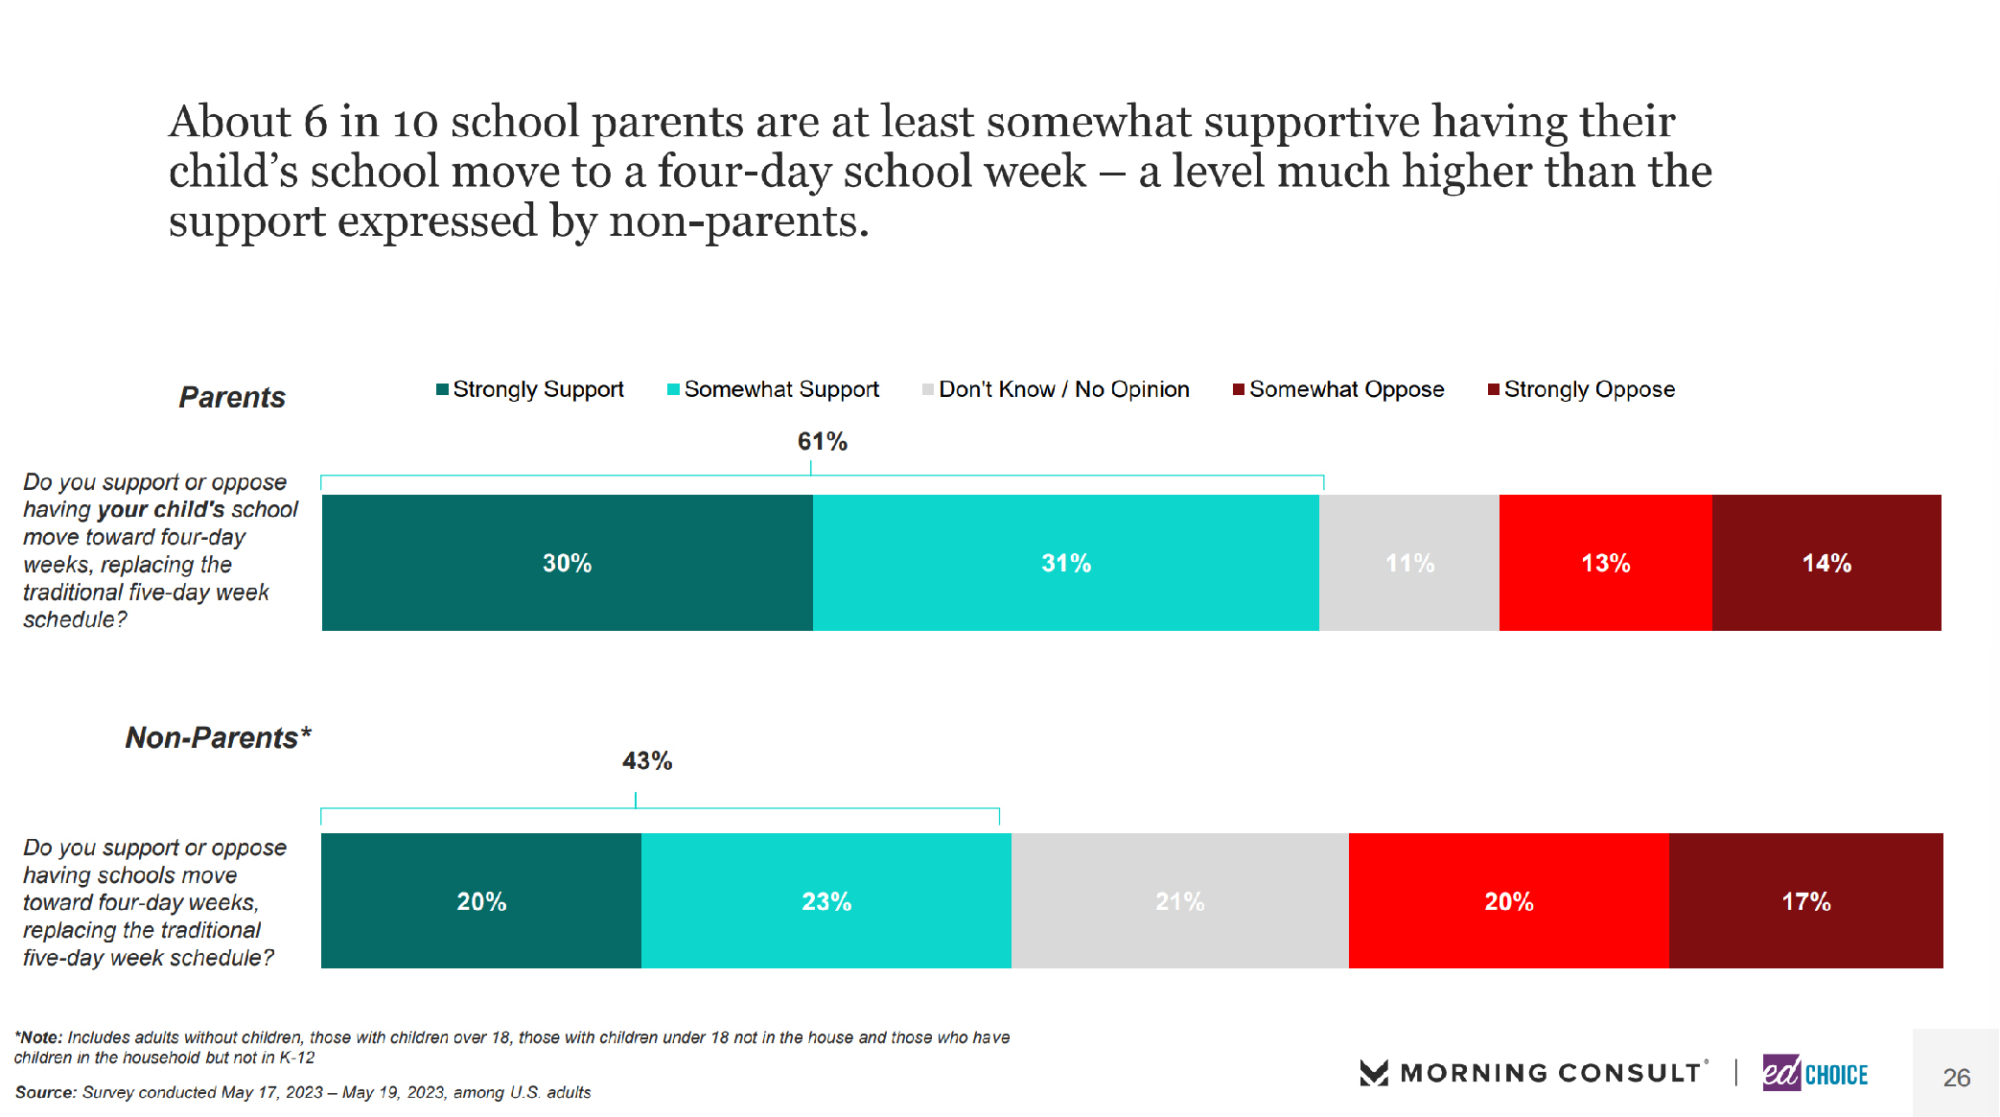
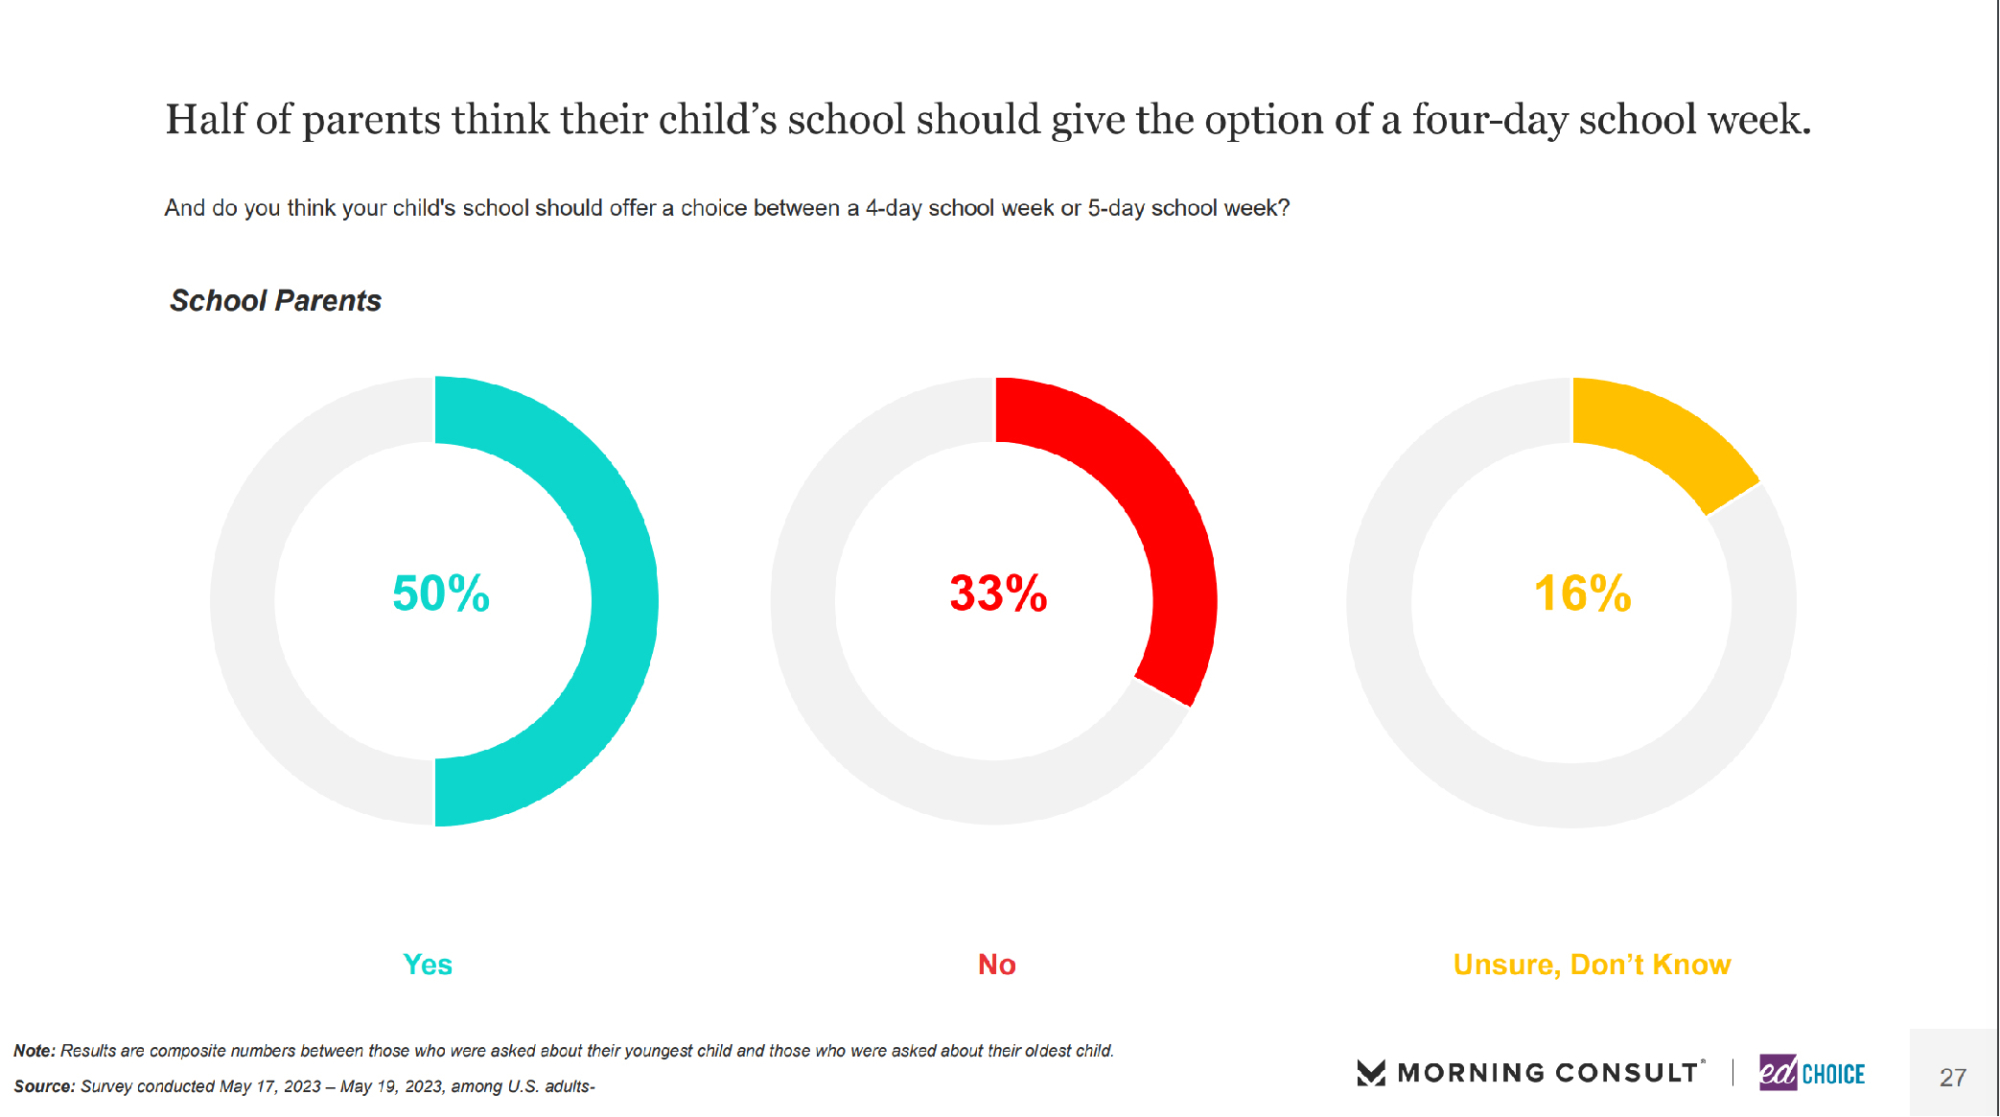
2. The majority of parents would support their child’s school moving to a four-day school week. For the first time, we asked respondents the question: “Do you support or oppose having your child’s school move toward four-day weeks, replacing the traditional five-day week schedule?” Roughly 60 percent of parents signaled they would support their child’s school moving towards a 4-day school week. Only 27 percent of parents oppose switching to a 4-day school week. Non-parents were less enthusiastic about this idea, with only 43 percent saying they would support the change. Half of parents want their child’s school to offer the choice between a 4-day school week or a 5-day school week.
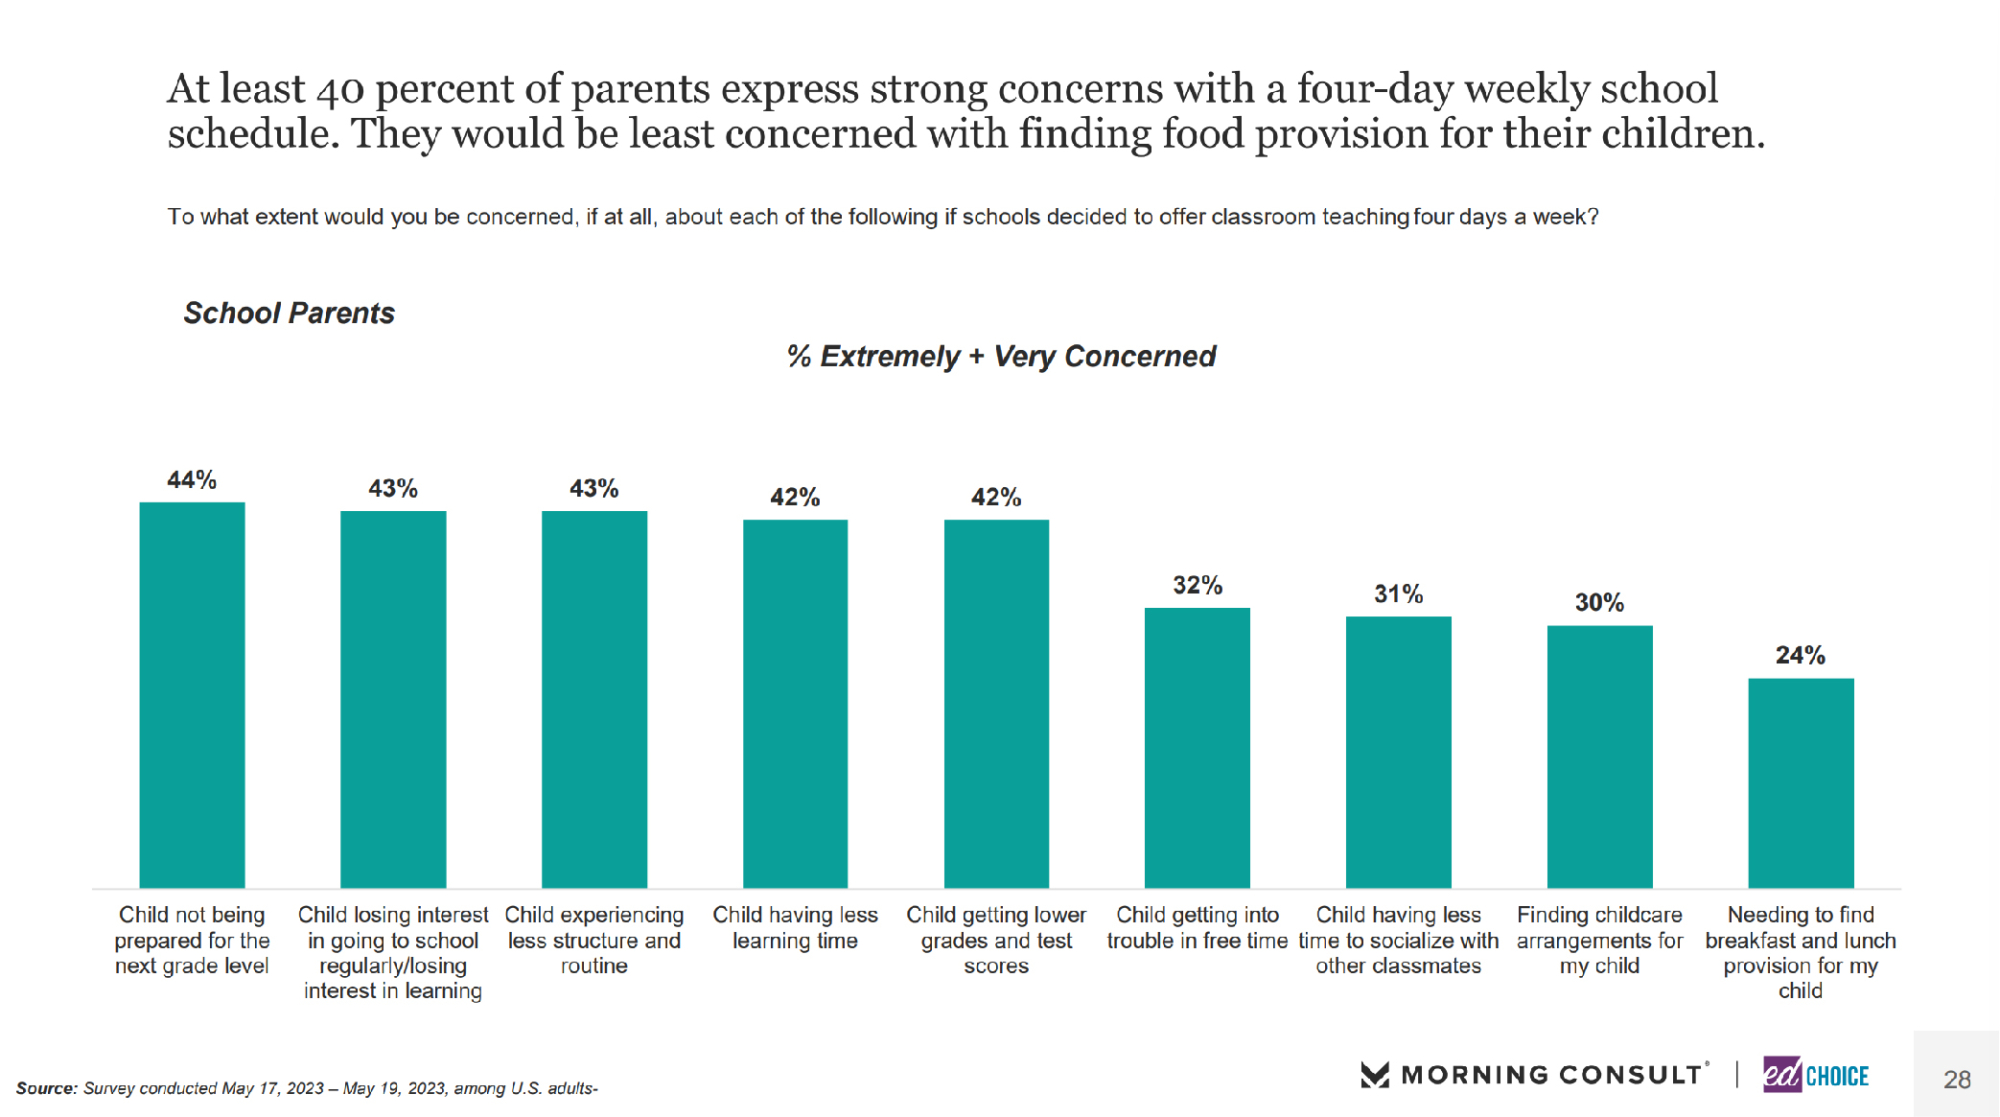
We also asked parents what their biggest concerns would be if their child’s school offered 4-day school weeks. Parents’ biggest concerns were their child not being prepared for the next grade level (44%), their child losing interest in going to school or losing interest in learning (43%), and their child experiencing less structure and routine (43%). Additionally, 30 percent of parents are concerned about finding childcare for their child if their school were to move to a four-day school week.
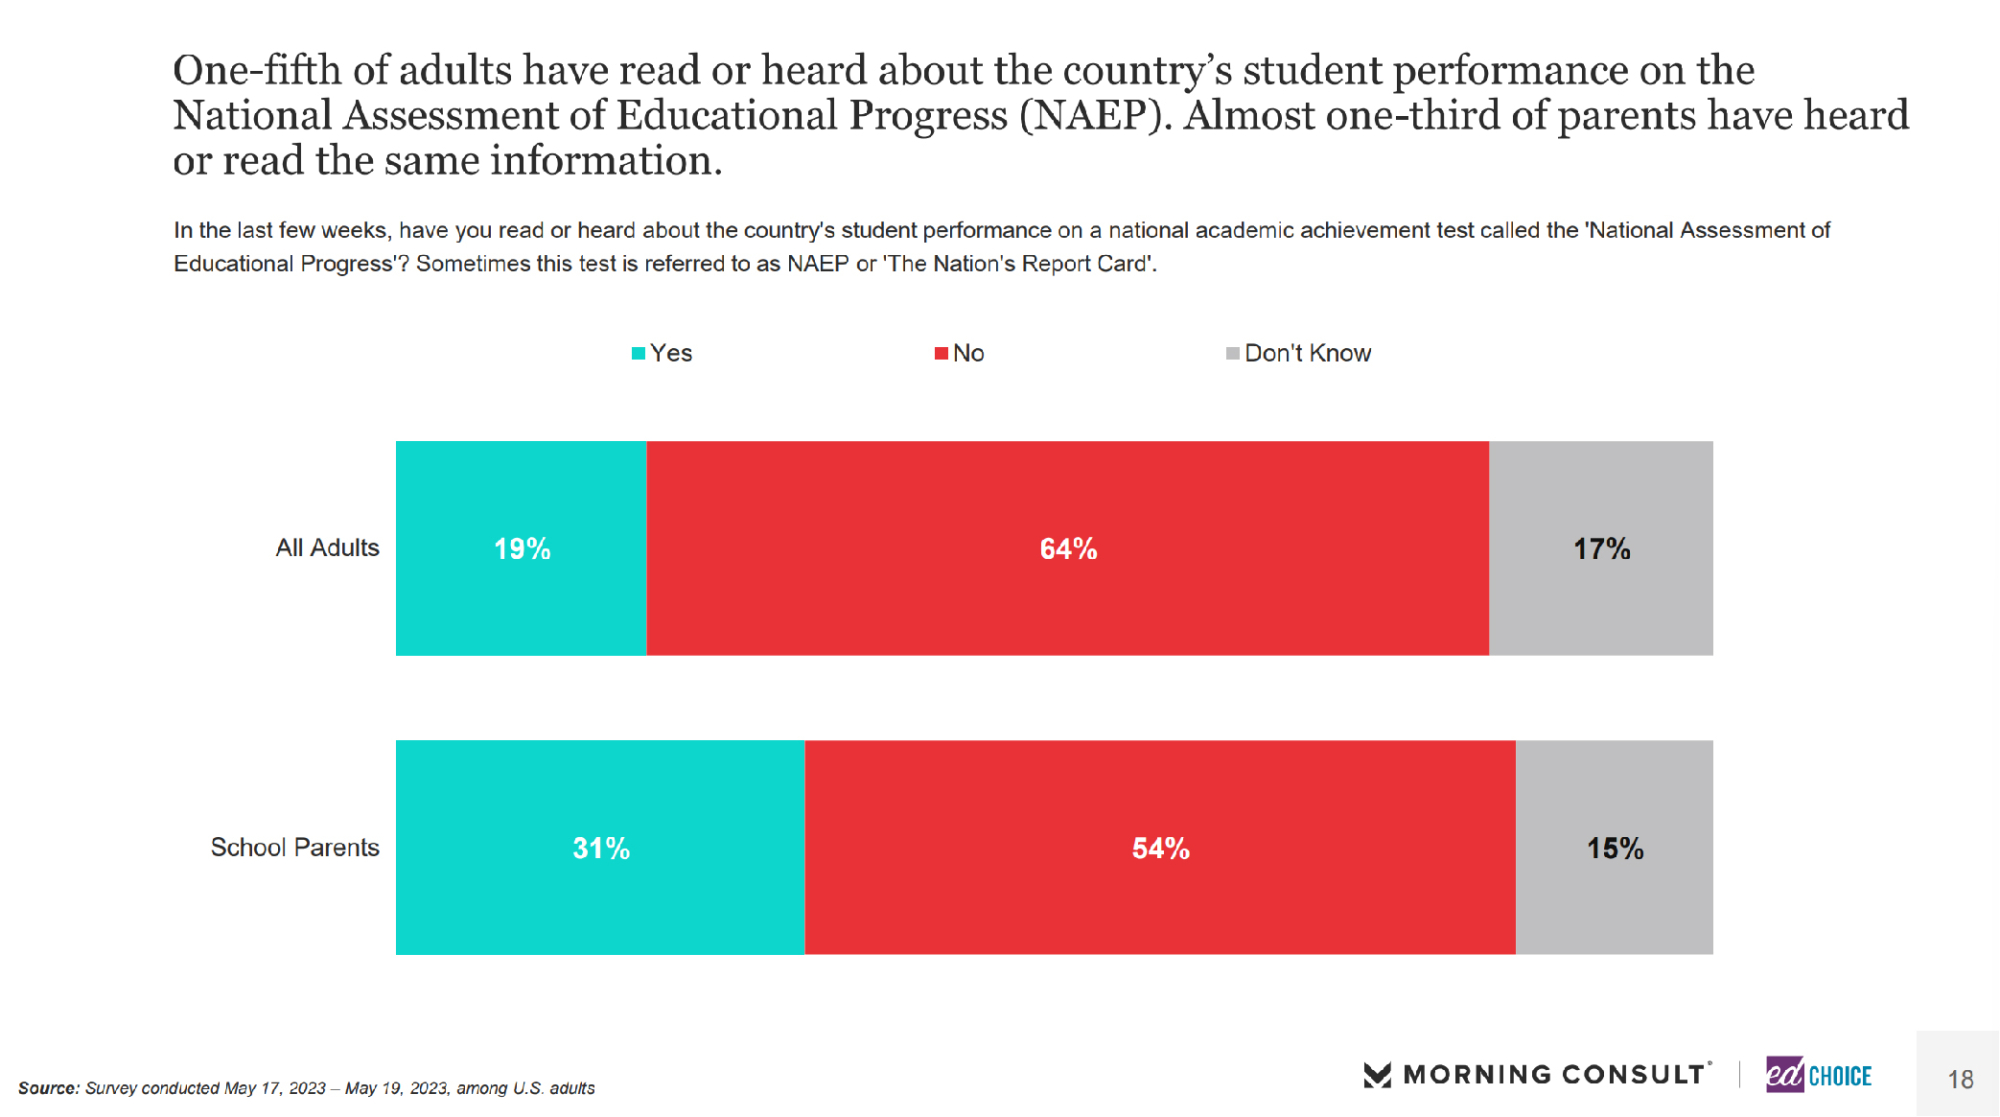
3. When given context, the majority of Americans are concerned about the latest National Assessment for Educational Progress (NAEP) results. We gauged respondents’ awareness of students’ performance on the NAEP with the question “In the last few weeks, have you read or heard about the country’s student performance on a national academic achievement test called the ‘National Assessment of Educational Progress’?” Only 19 percent of Americans had read or heard about the NAEP results. Parents were much more aware of the NAEP scores, with 31 percent saying they had read or heard about it.
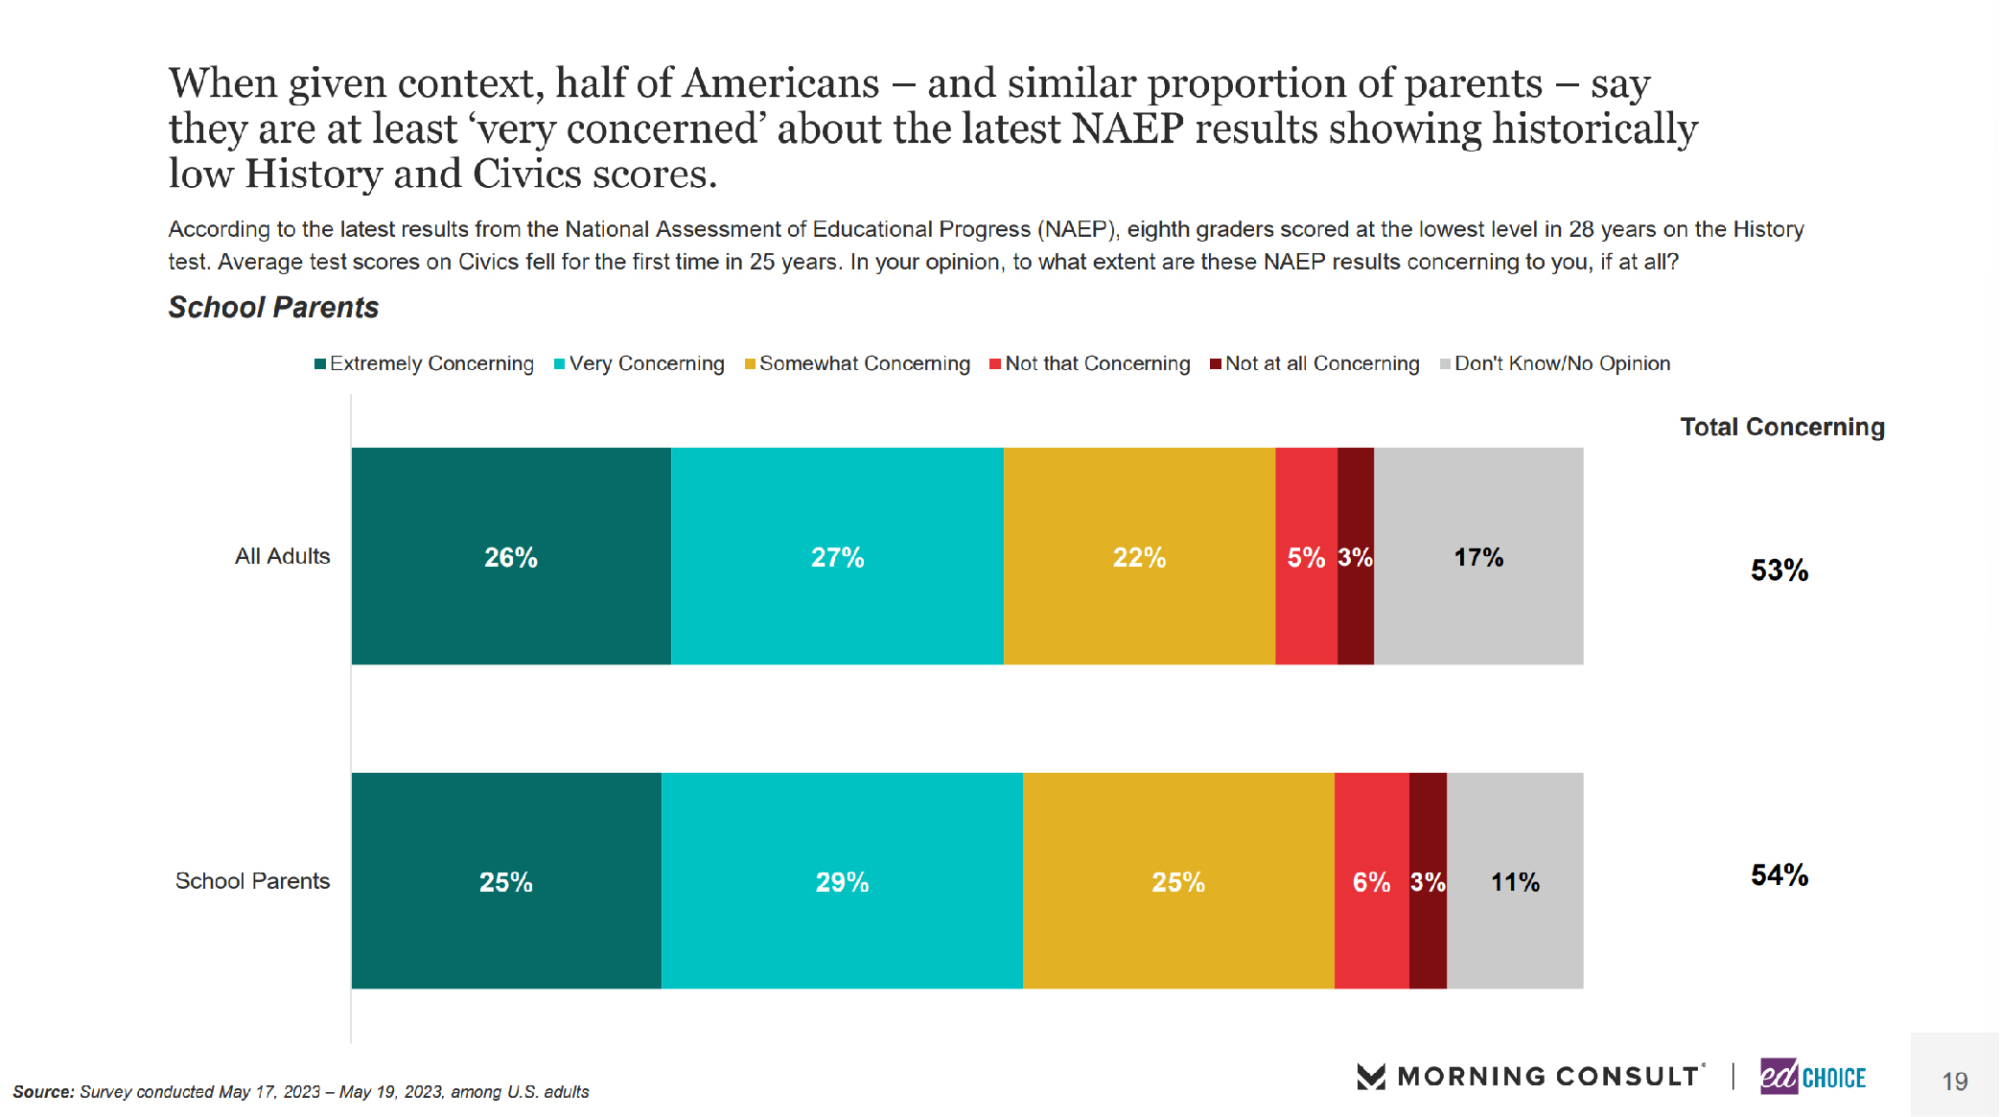
We also gauged the concern level of respondents, posing this question to respondents, “According to the latest results from the National Assessment of Educational Progress (NAEP), eighth graders scored at the lowest level in 28 years on the History test. Average test scores on Civics fell for the first time in 25 years. In your opinion, to what extent are these NAEP results concerning to you, if at all?” The majority of parents, as well as the general public, reported being concerned about the recent NAEP results.
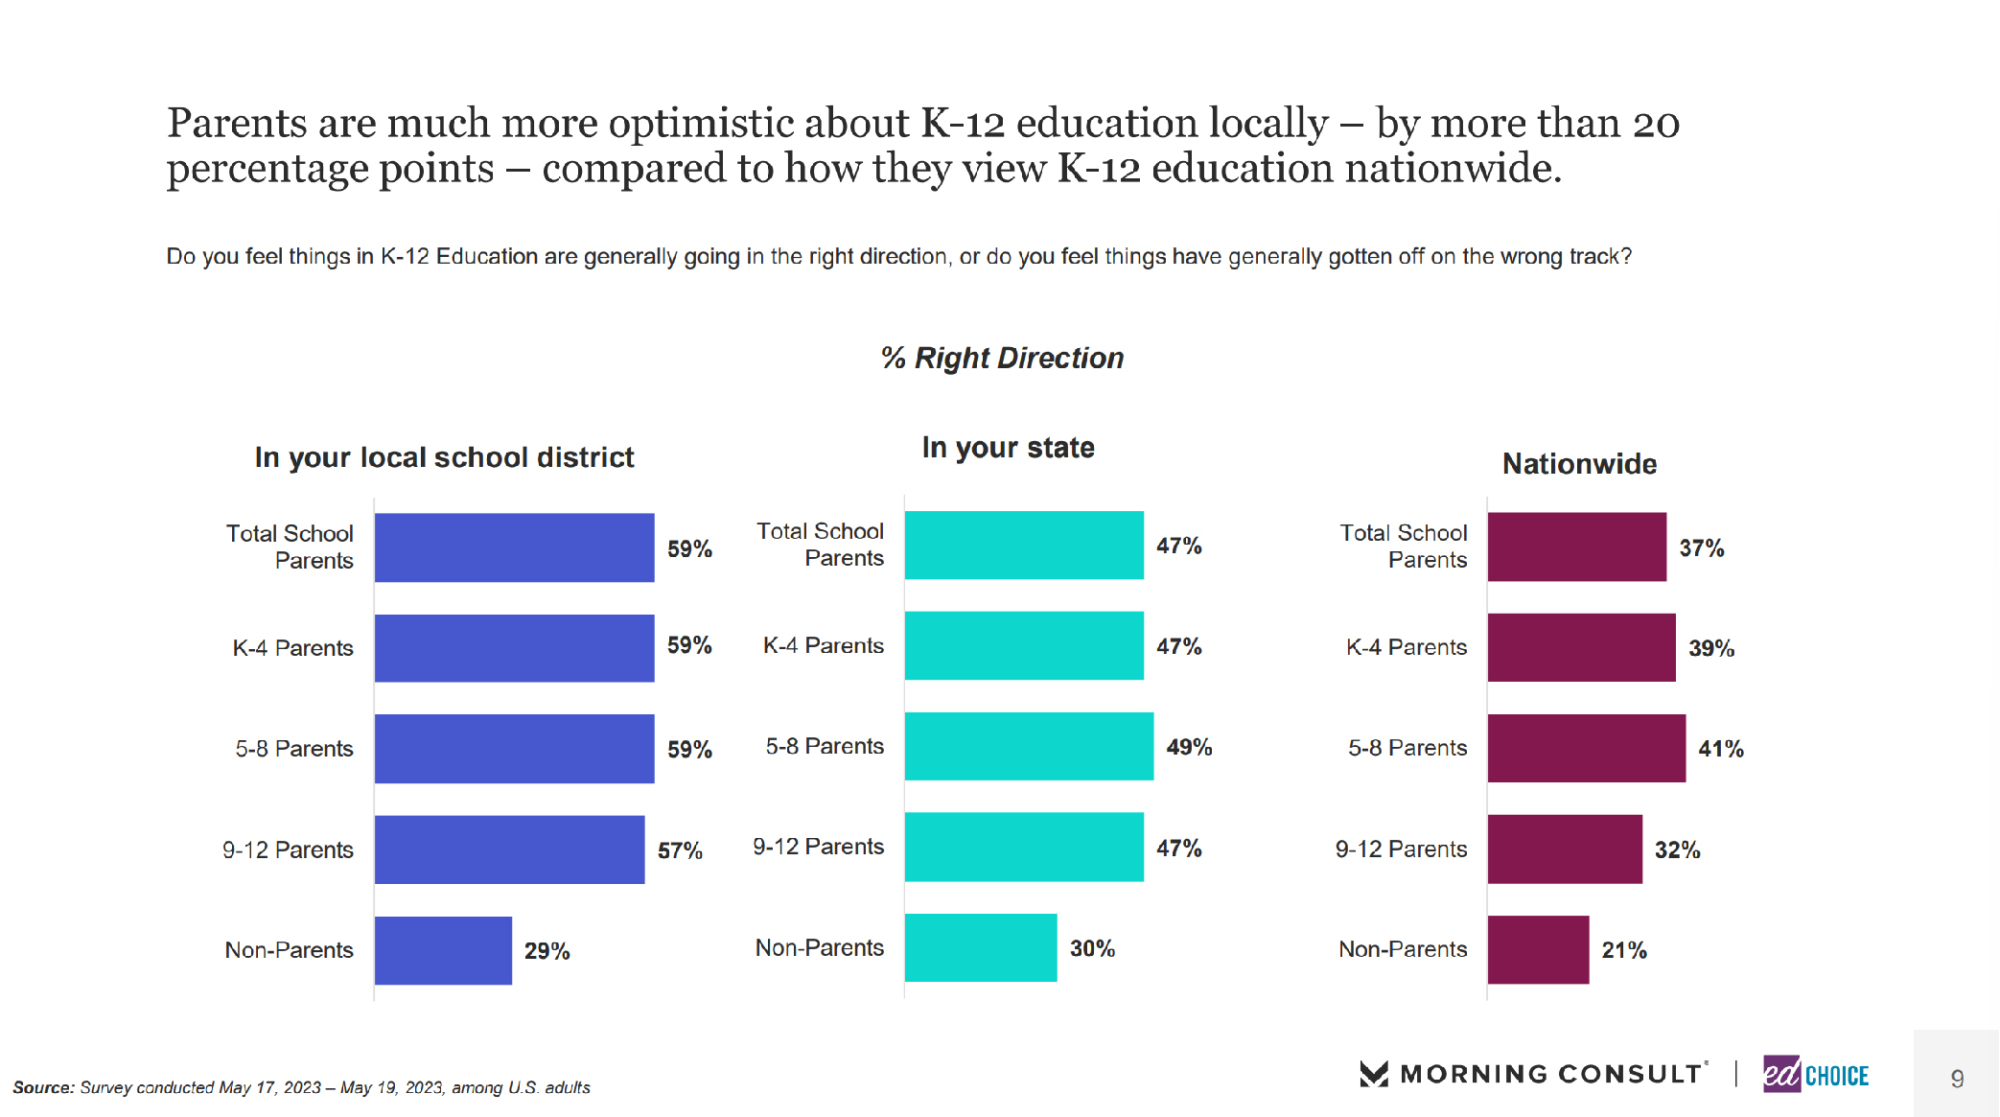
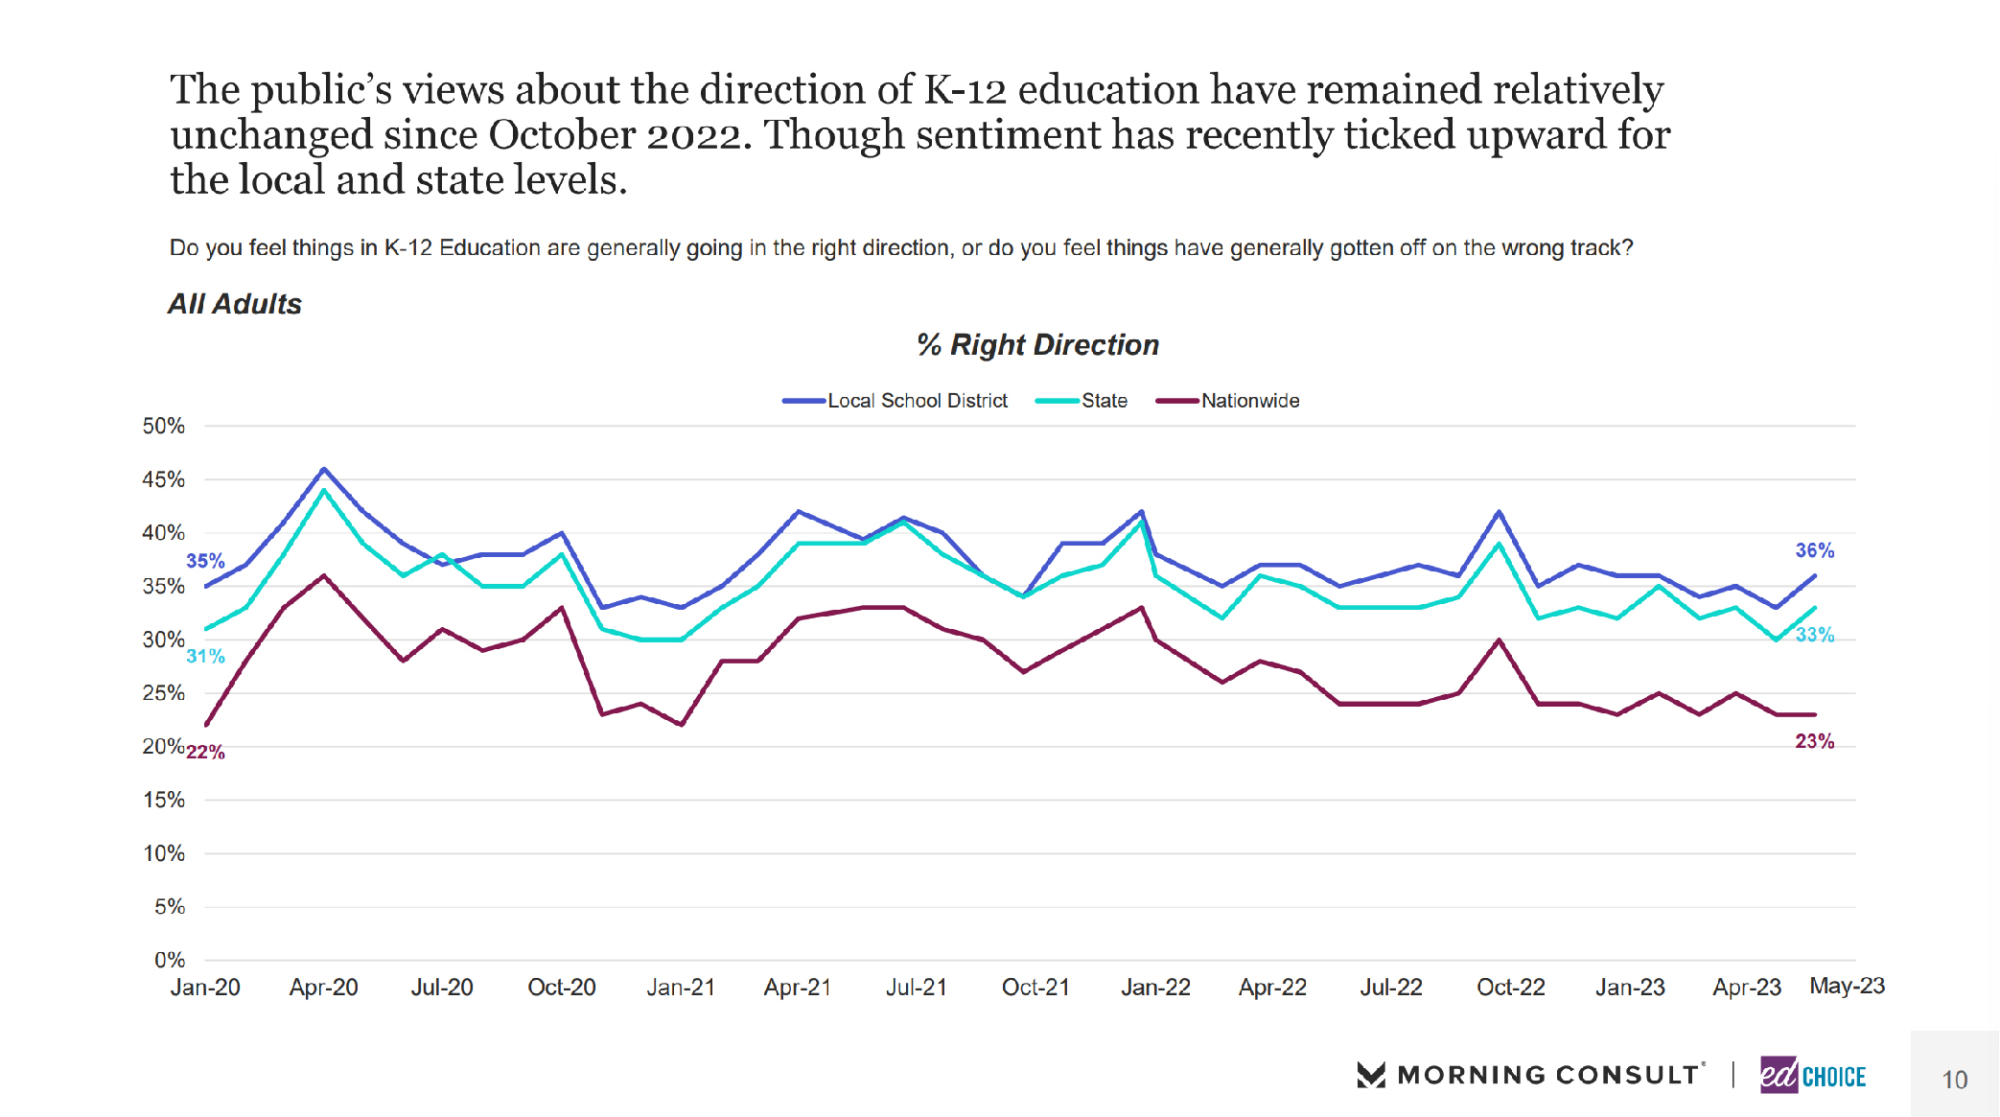
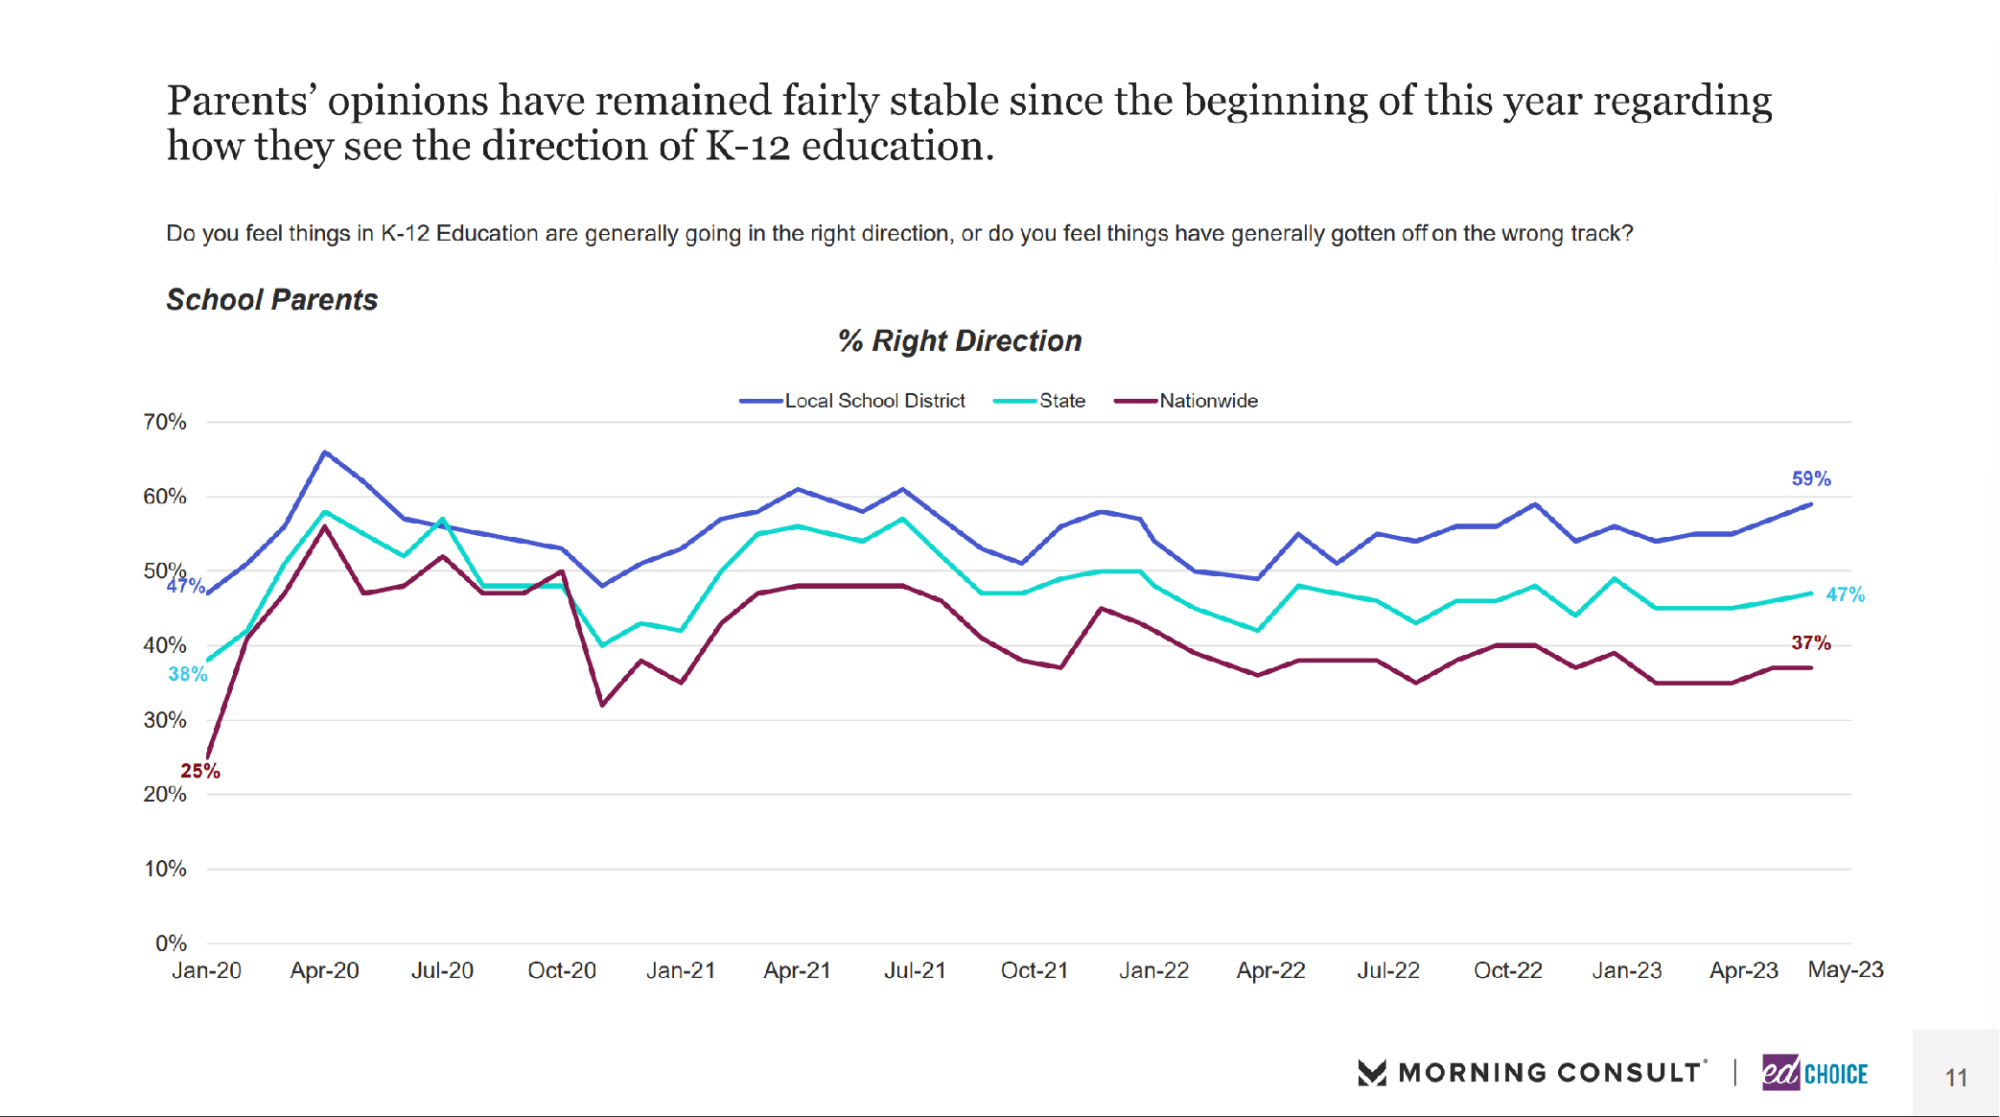
4. Americans’ optimism towards K-12 education increased in May. Roughly one-third of Americans feel K-12 education is headed in the right direction locally and statewide, up slightly from last month. Only 23 percent of Americans believe K-12 education is headed in the right direction nationwide, however. Parents are typically more optimistic than the general public when looking at K-12 education. Nearly 60 percent of parents feel K-12 education is headed in the right direction in their local school district, while 47 percent feel optimistic about education in their state. Both increased slightly from last month. Thinking about education nationwide, only 37 percent of parents feel it is headed in the right direction.
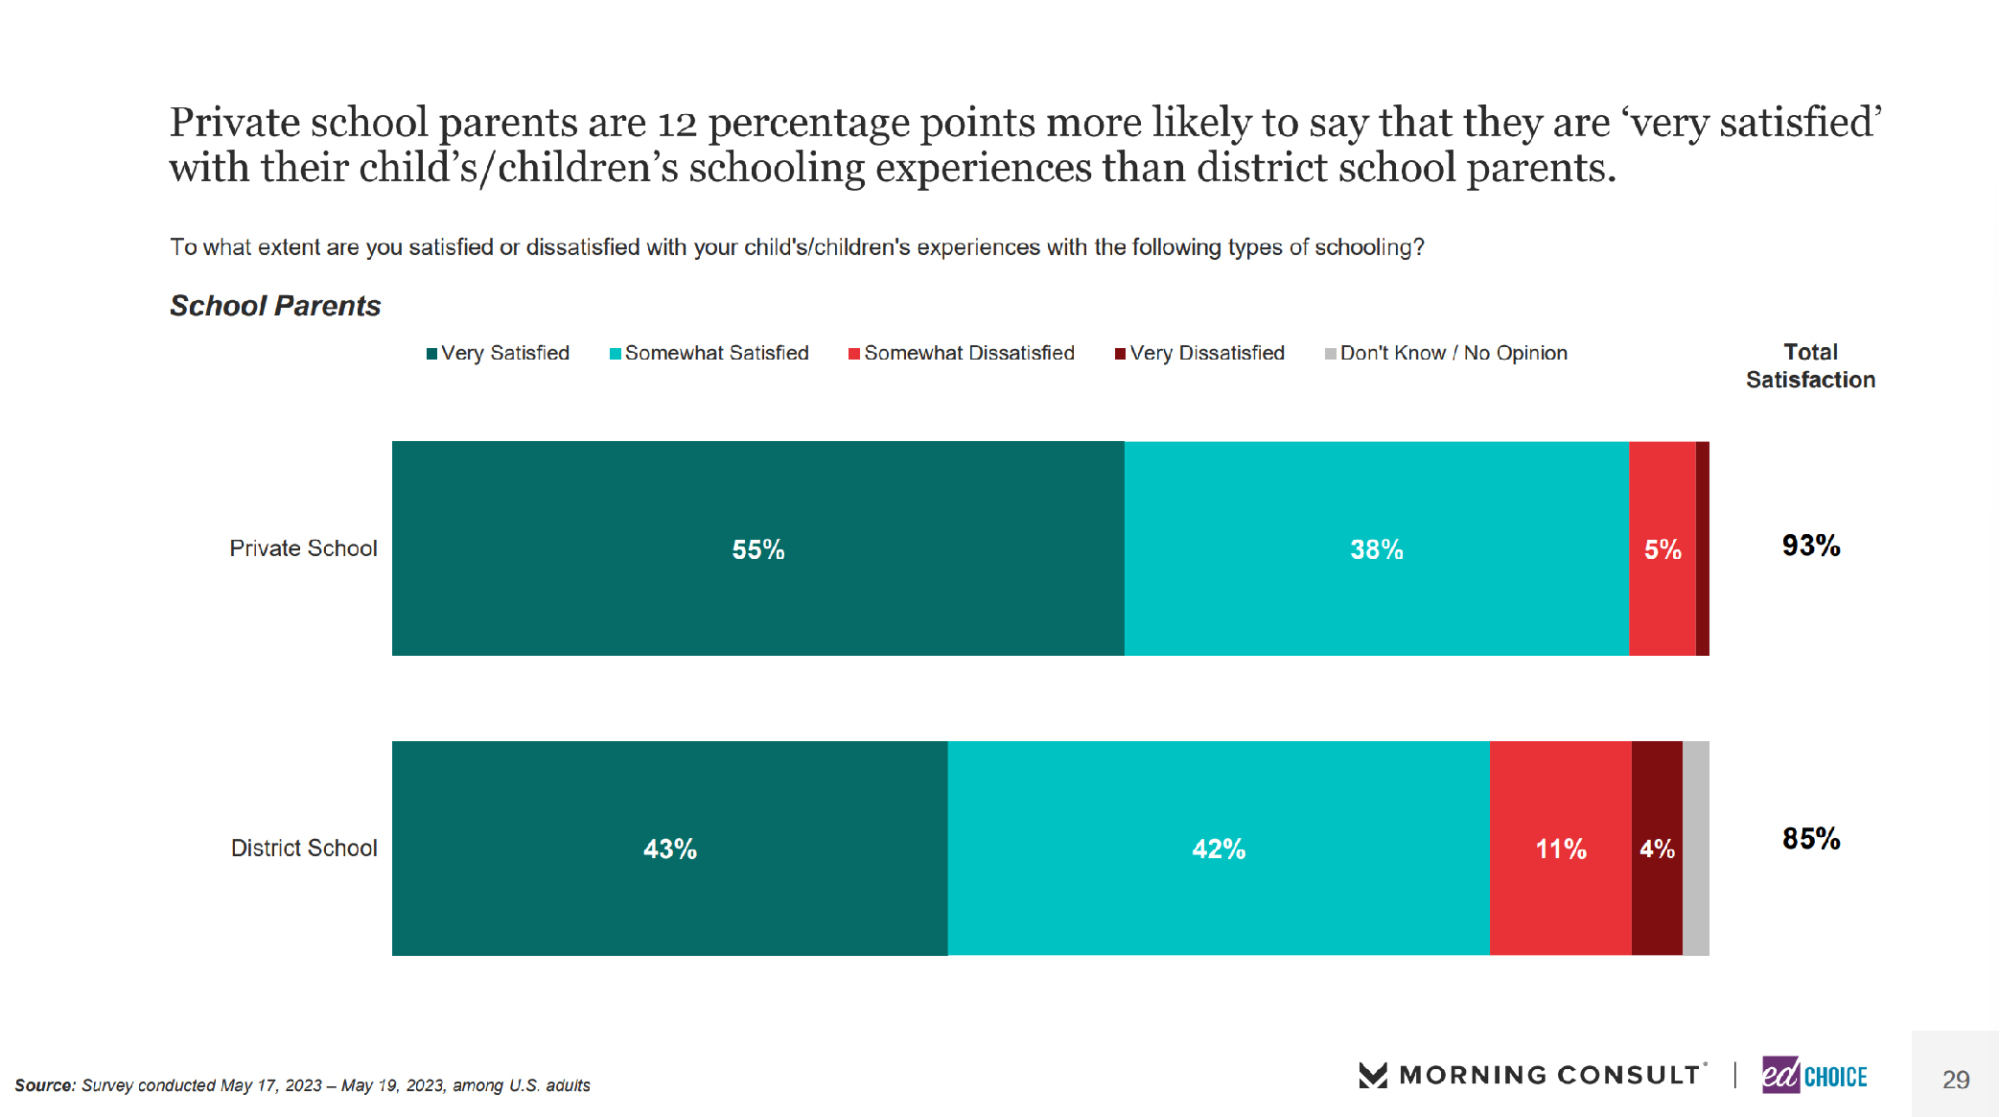
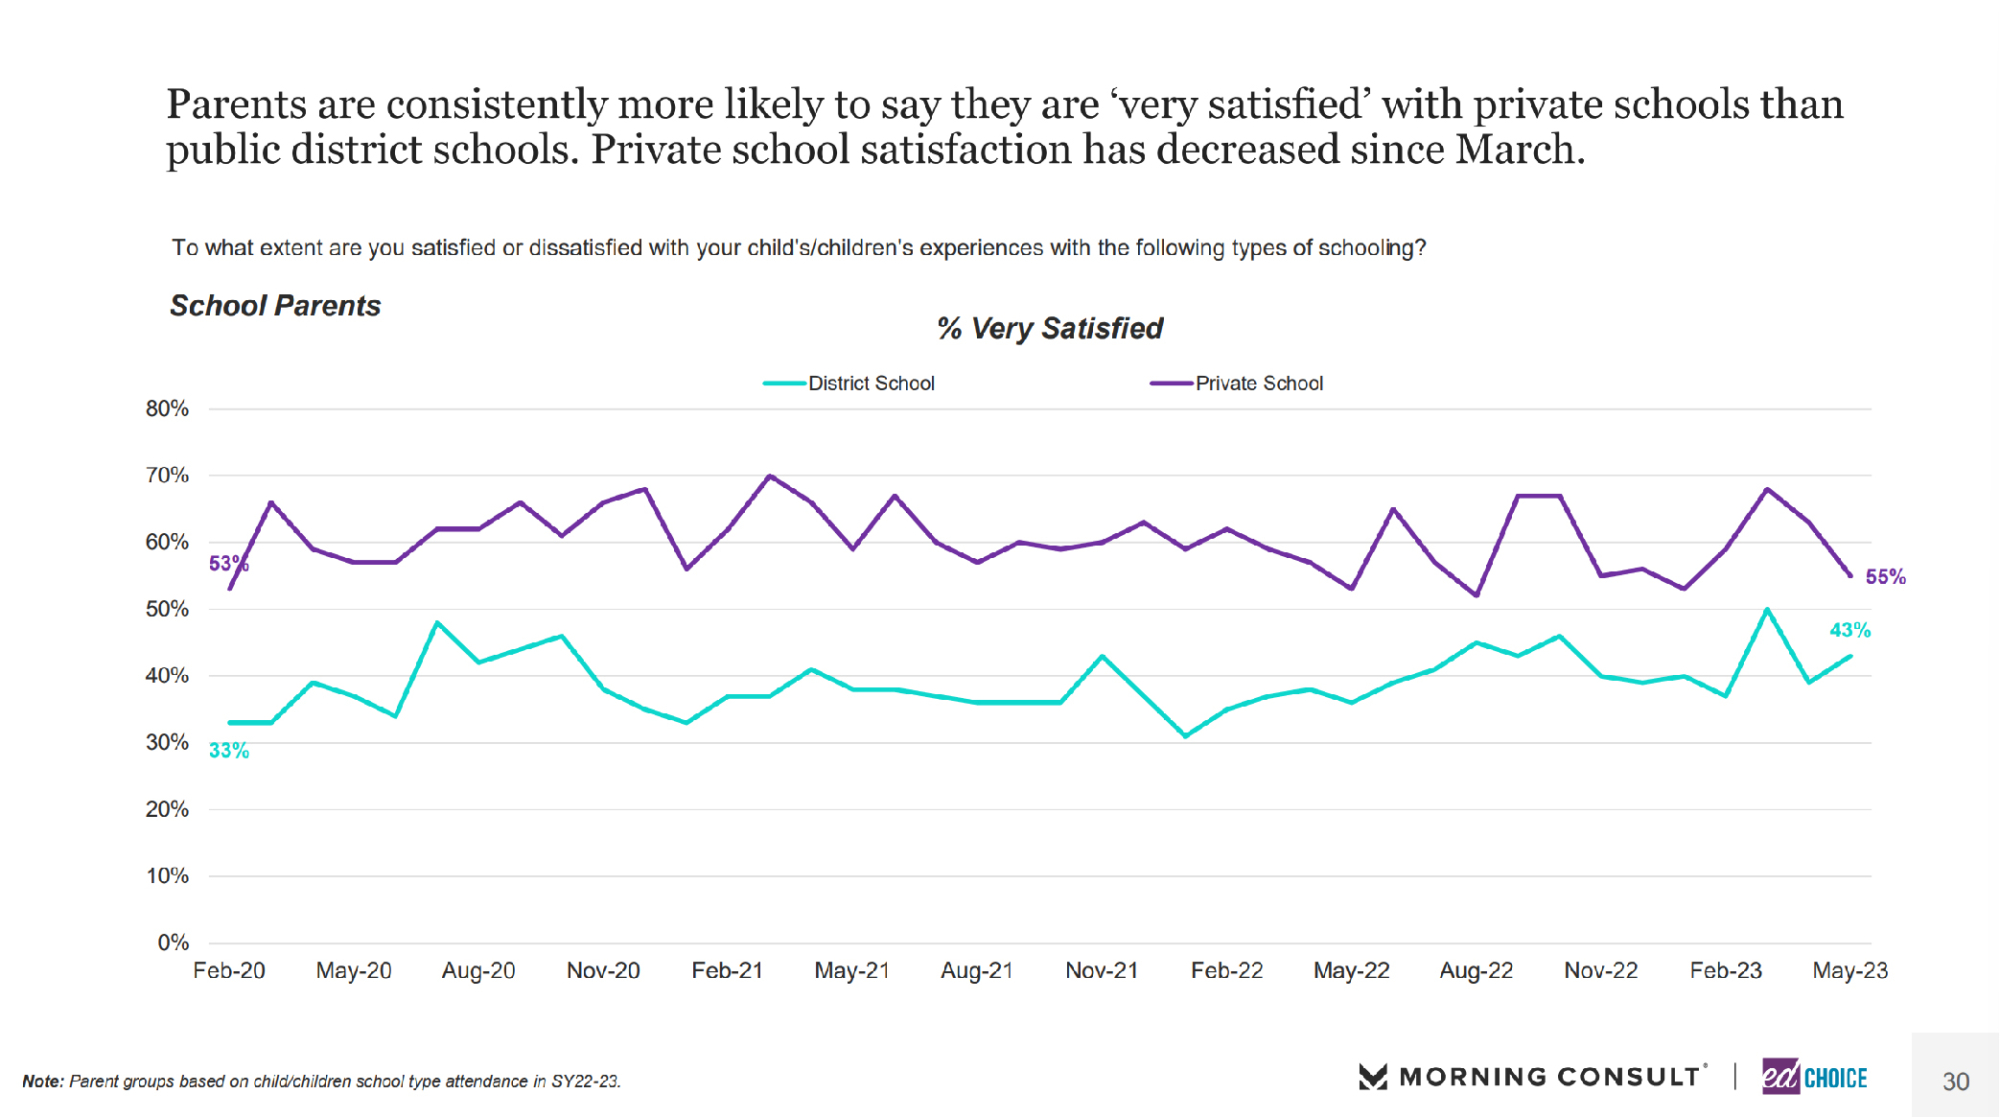
5. Private school parents are more likely than district school parents to say they are “very satisfied” with their child’s schooling experience. Although the gap shrunk slightly from last month, private school parents are typically more likely than district school parents to say they are very satisfied with their child’s schooling experience. This held true in May, with 55 percent of private school parents feeling very satisfied with their child’s schooling experience compared to 43 percent of district school parents feeling the same. That said, overall satisfaction with their child’s schooling experience remains very high among both private school parents (93%) and district school parents (85%).
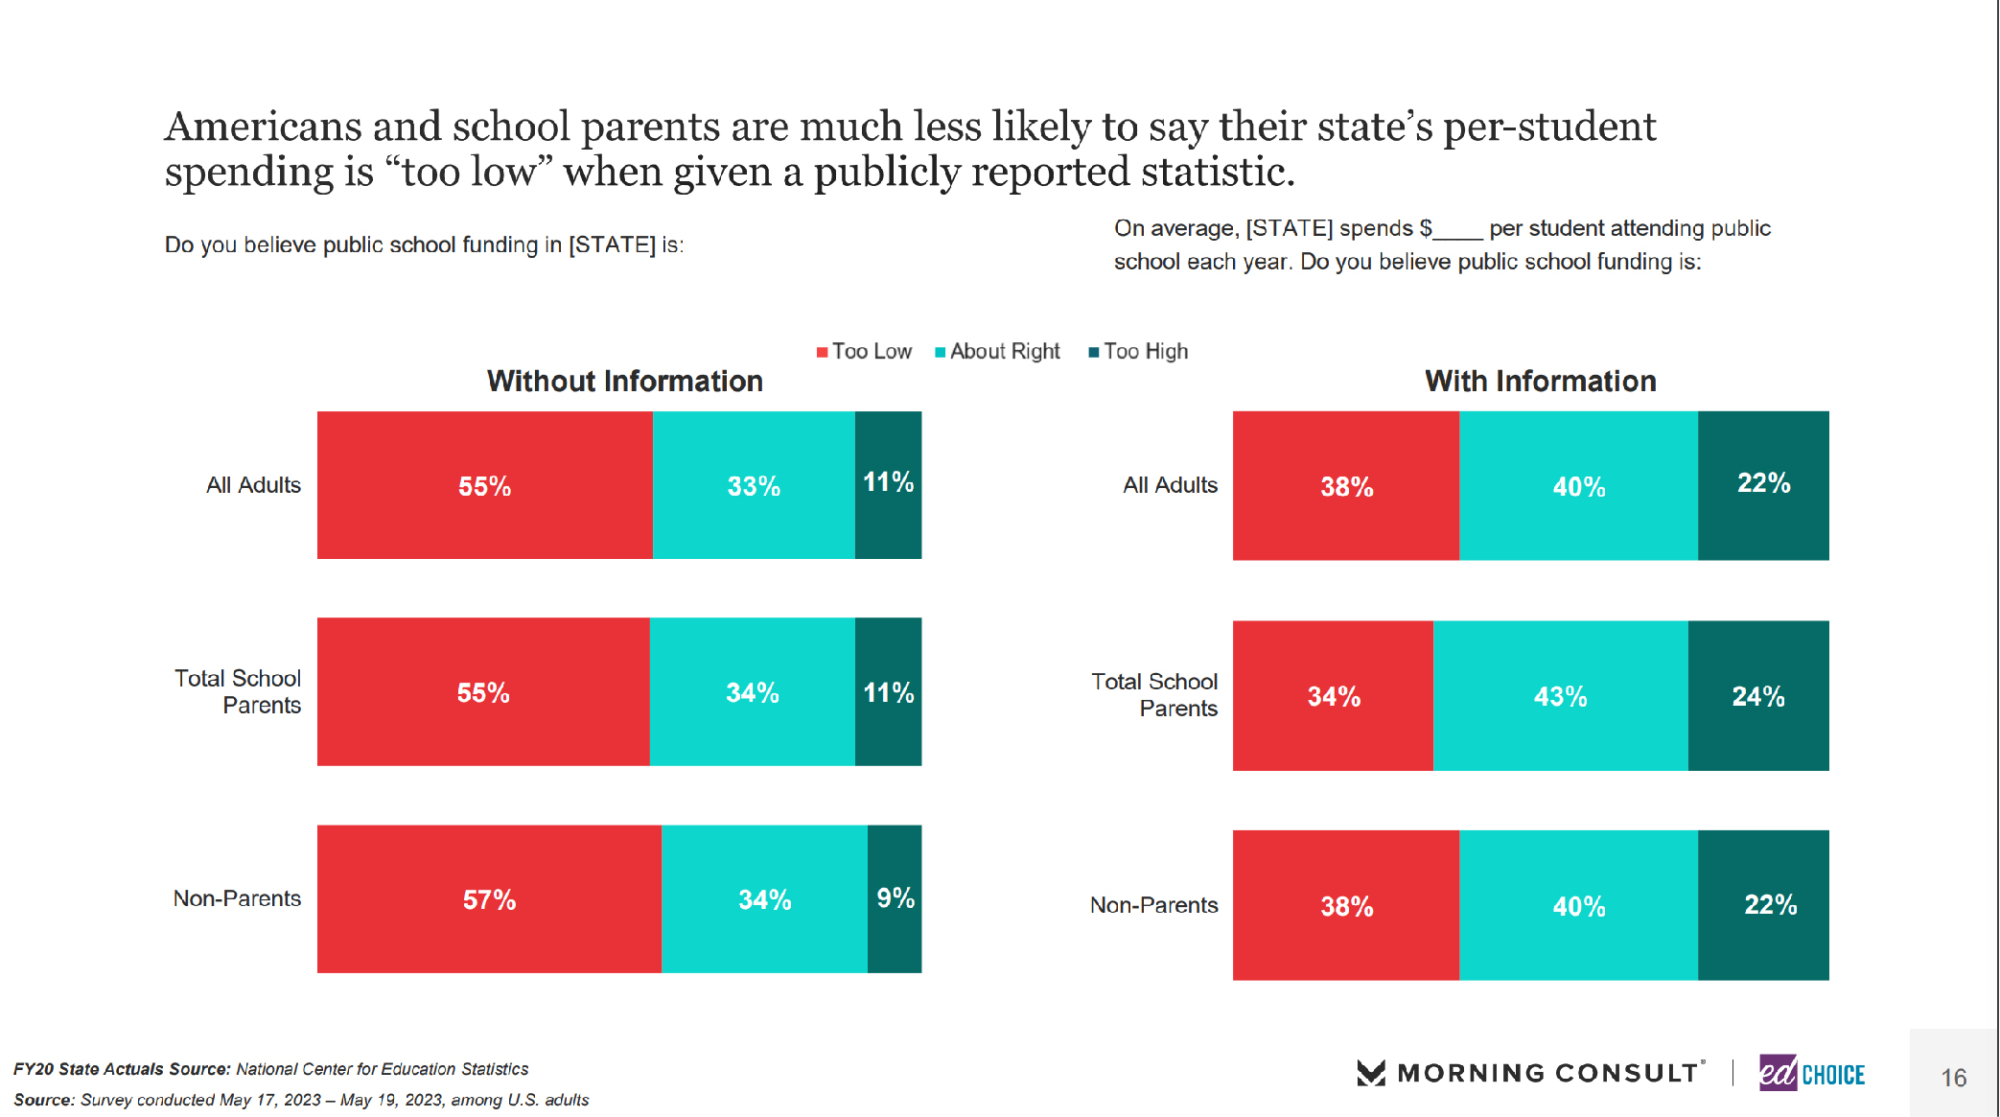
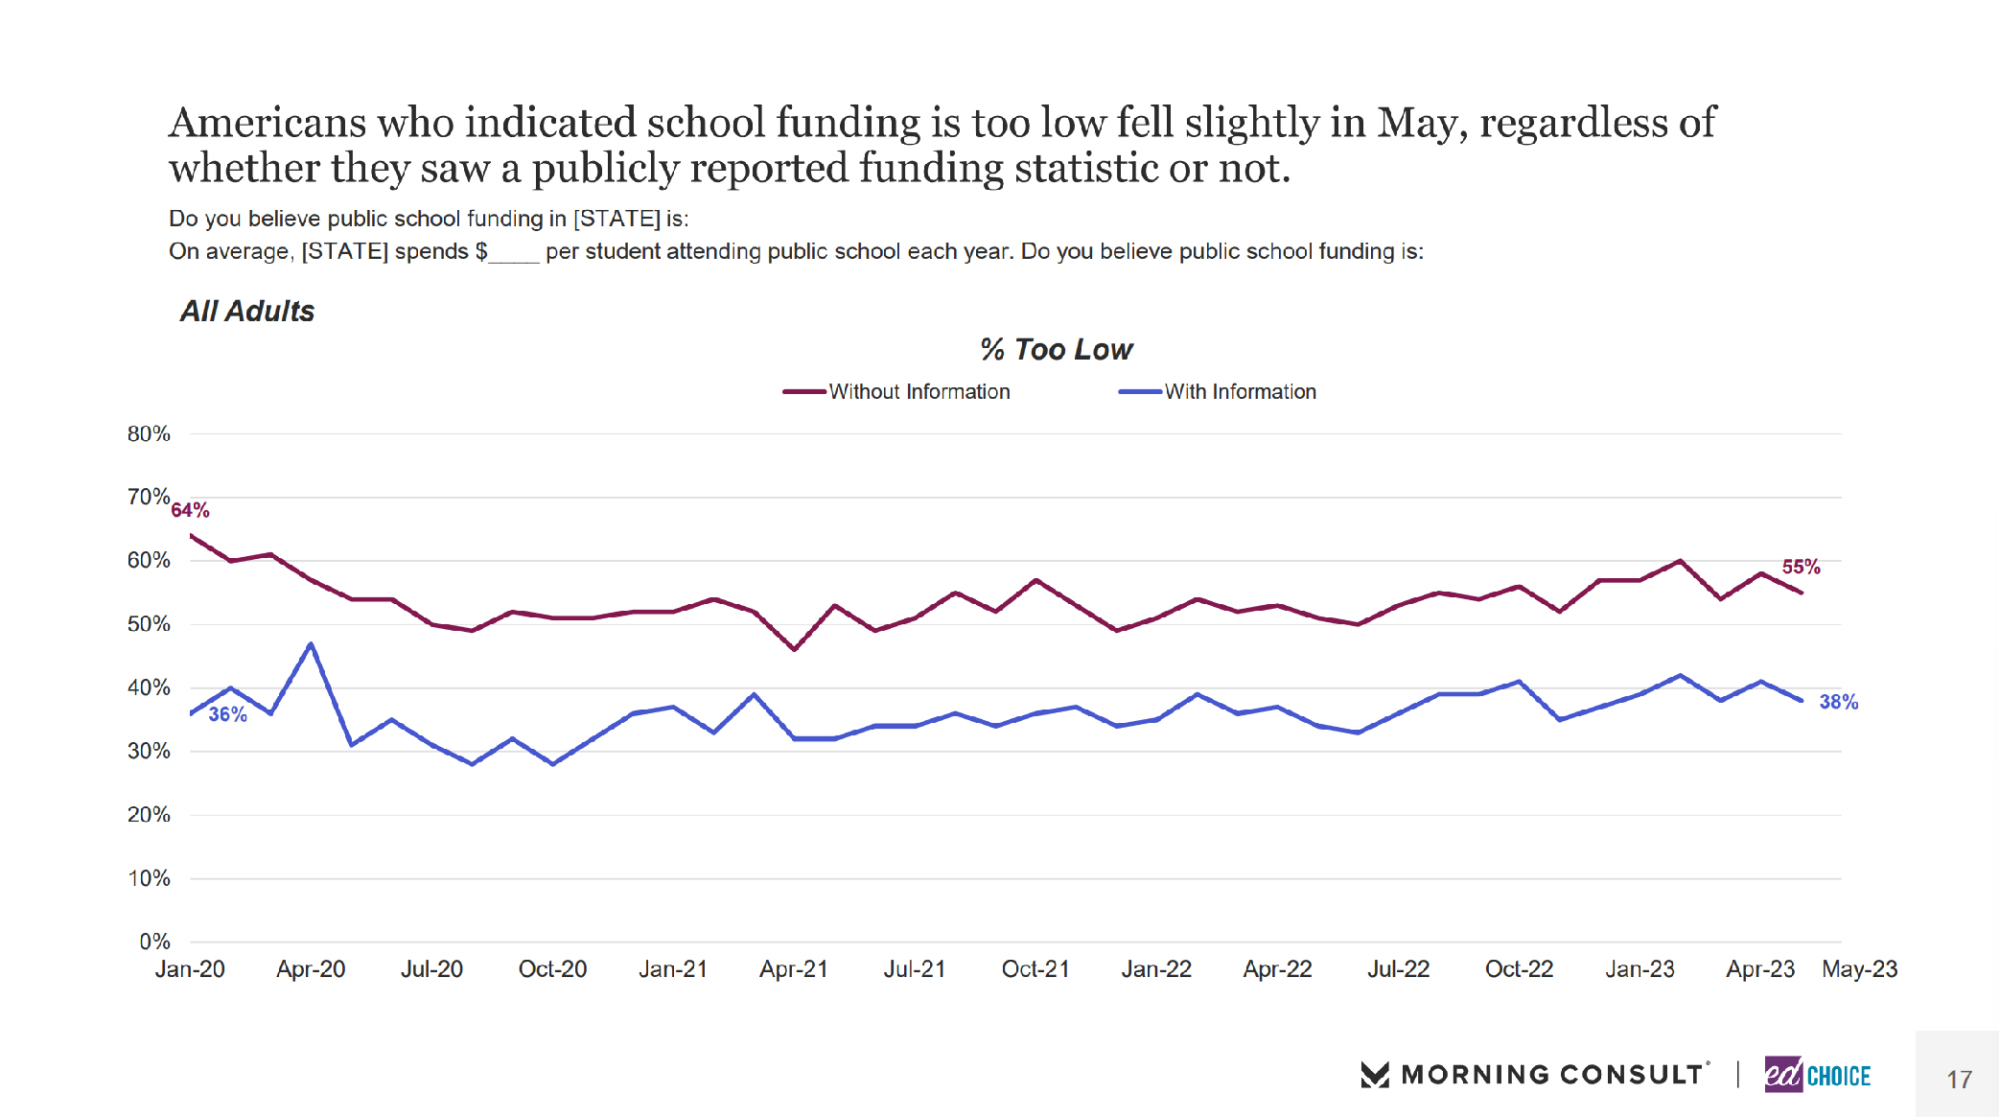
6. The general public and parents are much less likely to say their state’s per-pupil funding is “too low” when given a publicly reported statistic. We used a split sample question to gauge respondents’ feelings towards funding. By random selection, some respondents were given a publicly reported statistic to supplement the question regarding funding, while other respondents were asked about school funding without any information provided.
When asked about their state’s public-school funding, without any information provided, 55 percent of Americans and school parents believe their state’s funding for public schools is too low. Additionally, without any information provided, only 11 percent of the general public and school parents believe their state’s funding for public schools is too high. When shown a publicly recorded statistic on the matter, the proportion of Americans who believe their state’s funding for public schools is too low decreases significantly, dropping 15 points. The proportion of school parents who believe their state’s funding is too low plummets 21 points when shown a statistic on the matter. Furthermore, the proportion of Americans and school parents who believe their state’s funding for public schools is too high more than doubles when shown a statistic.
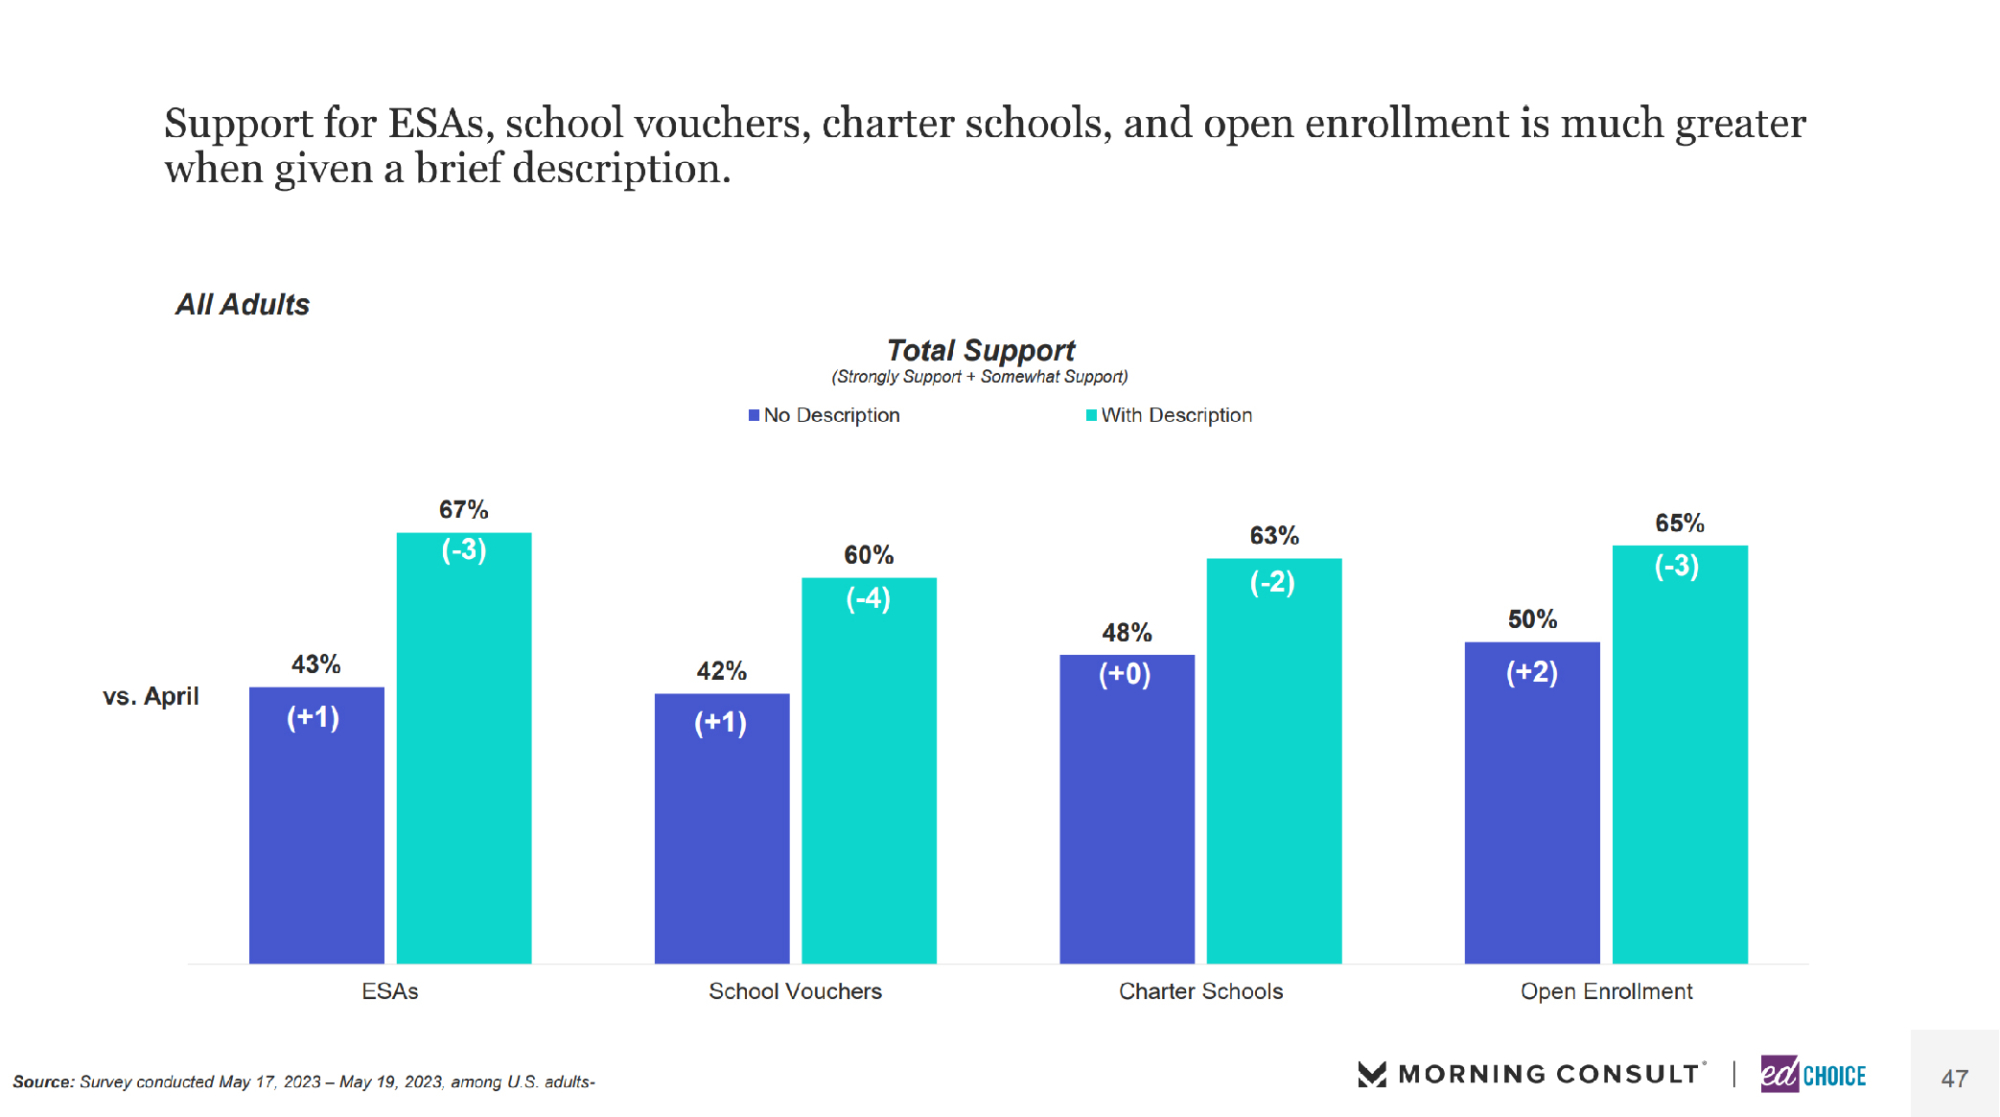
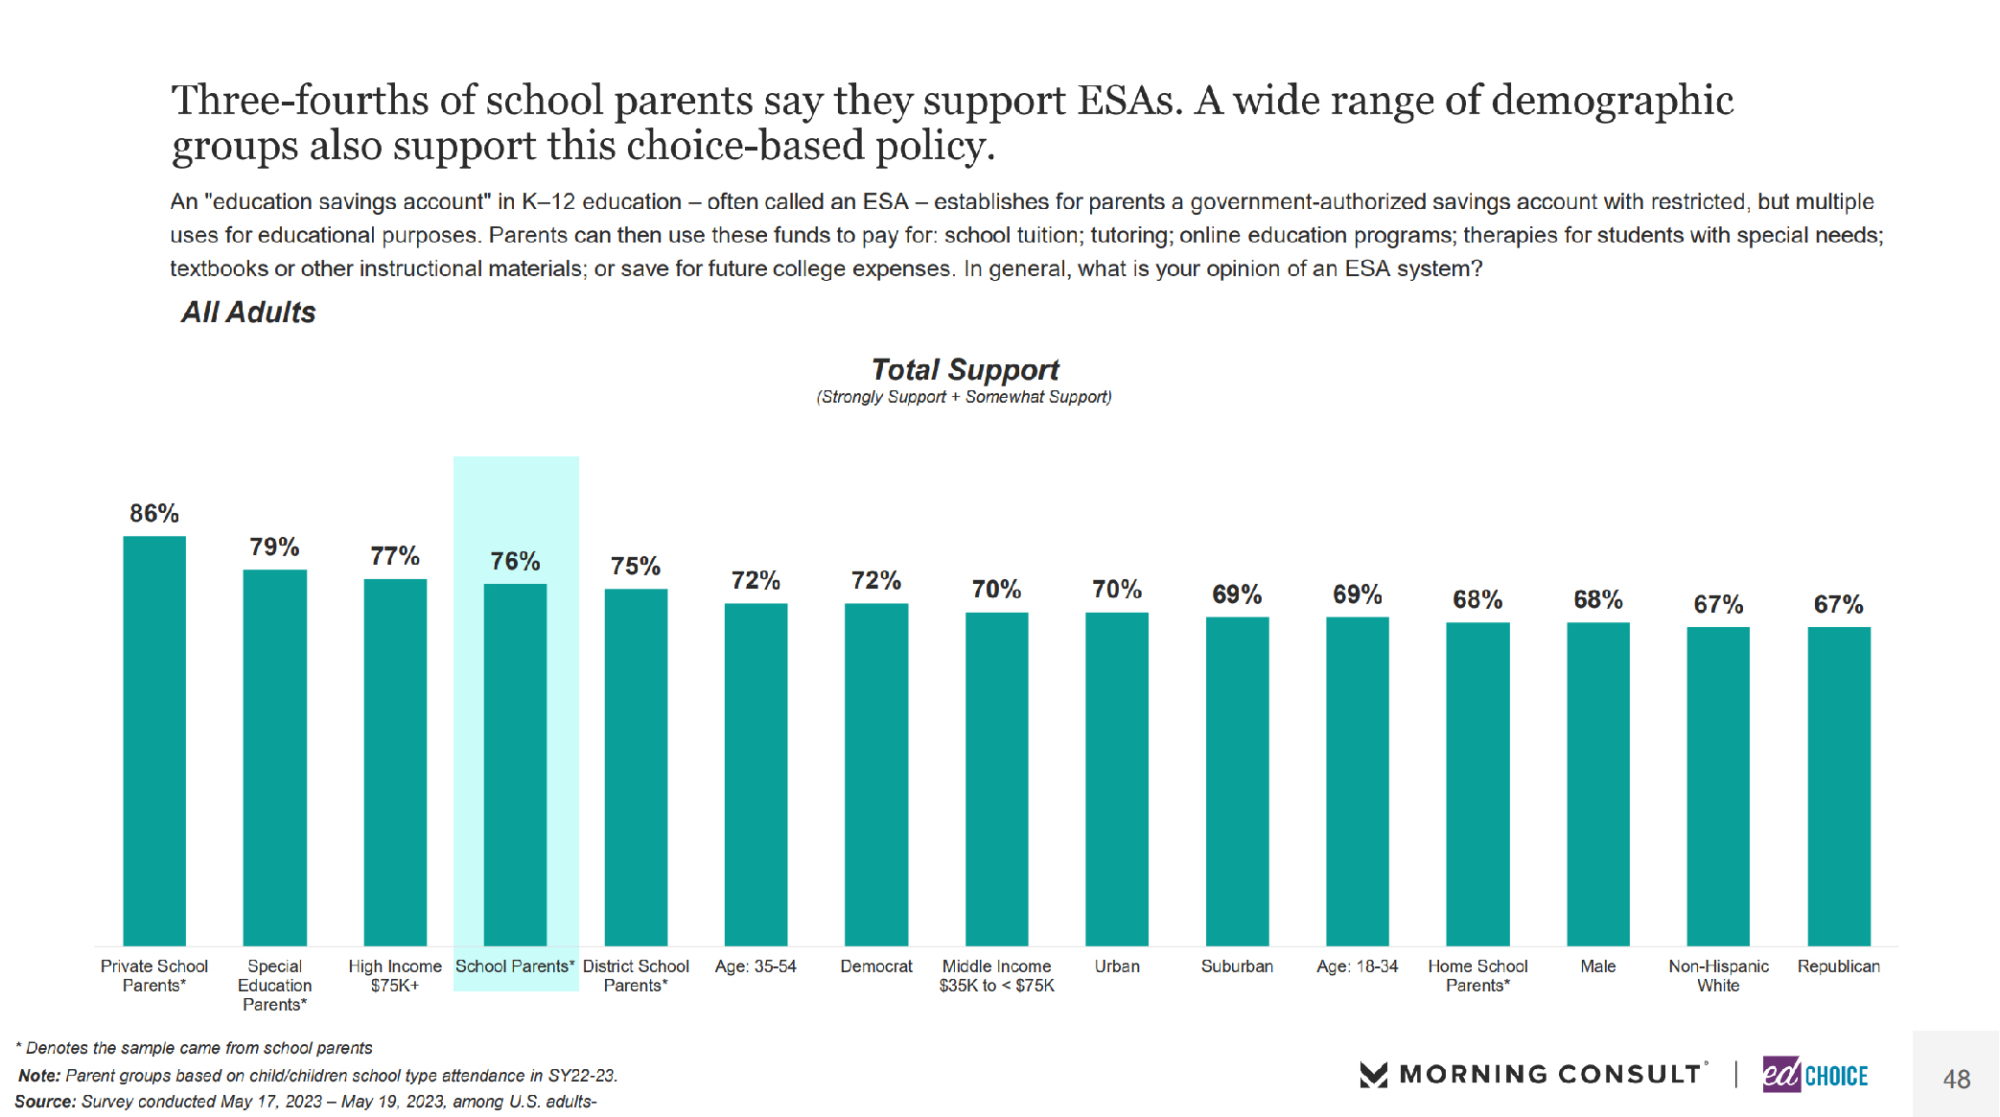
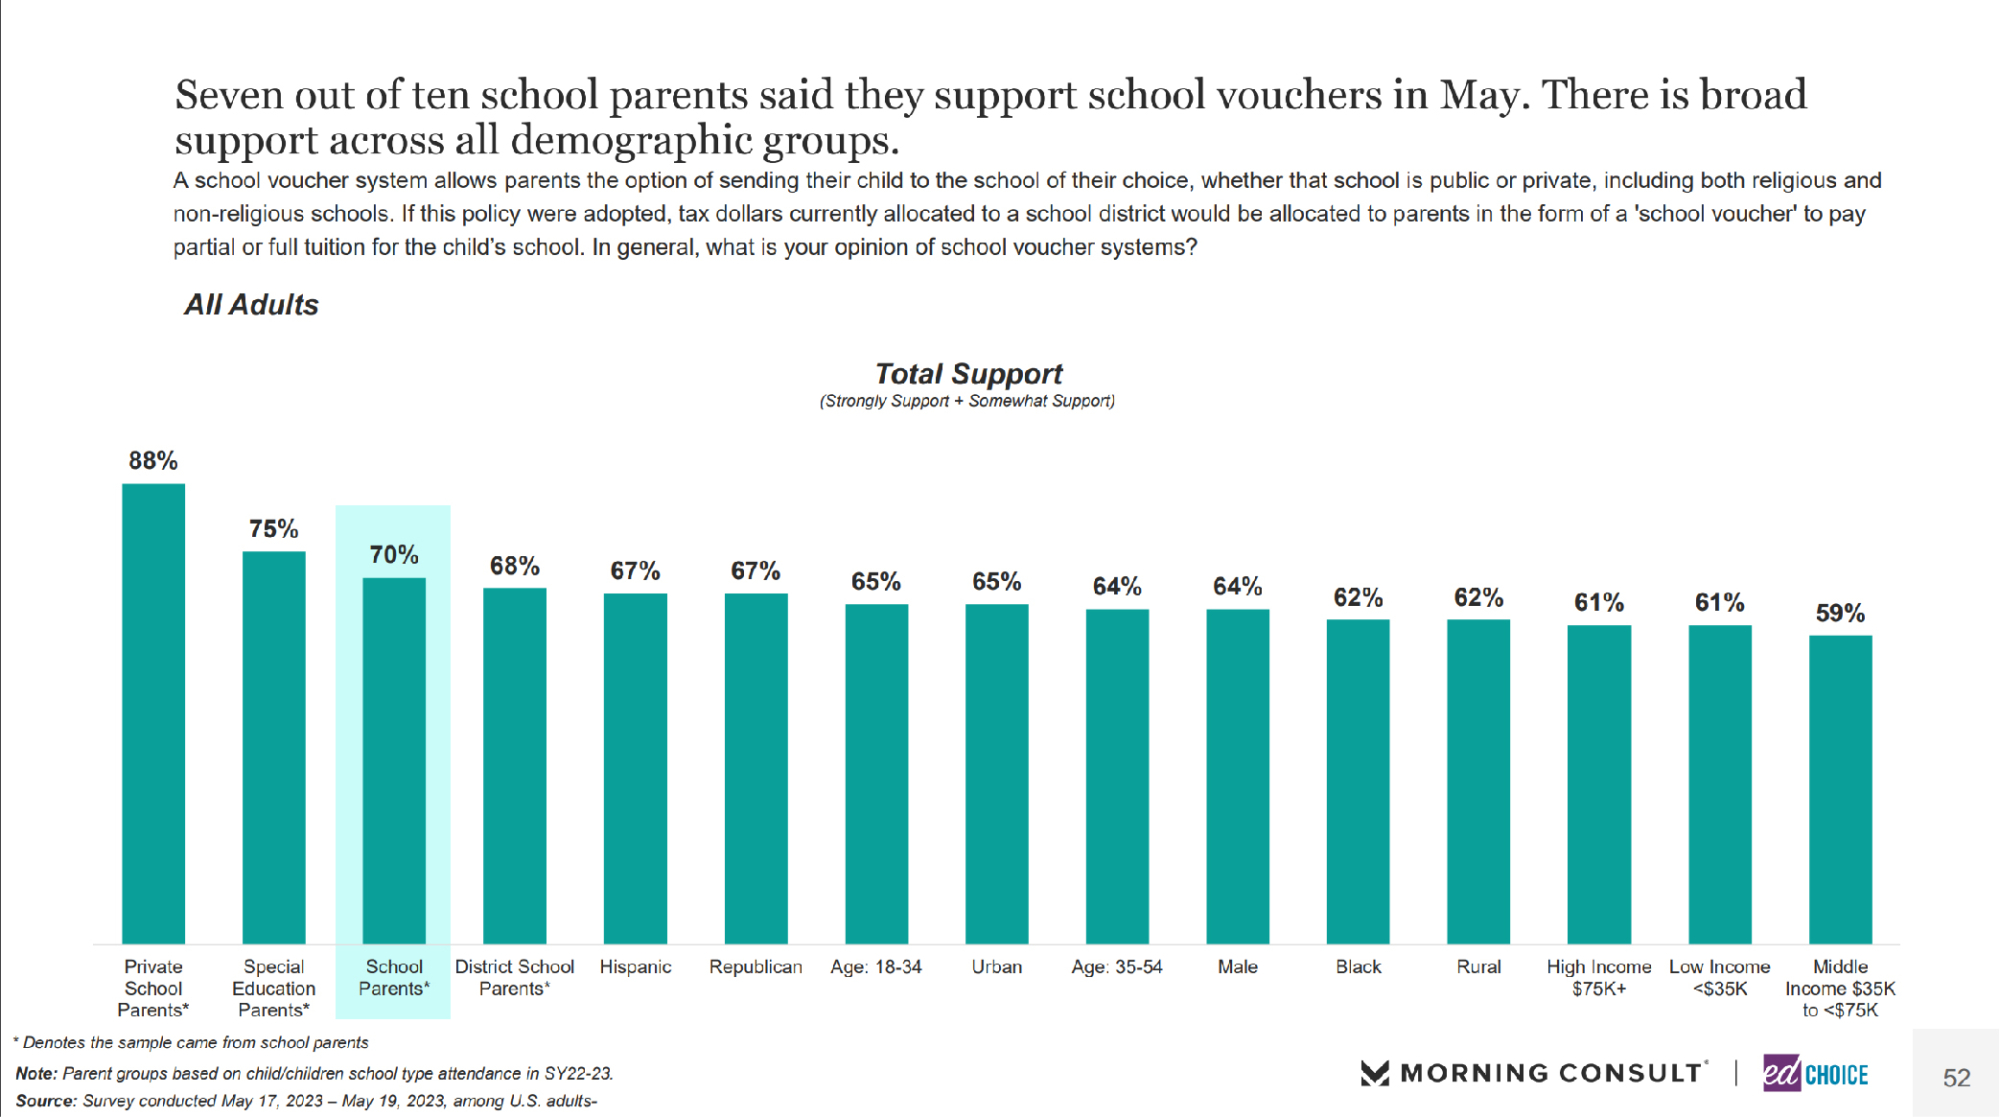
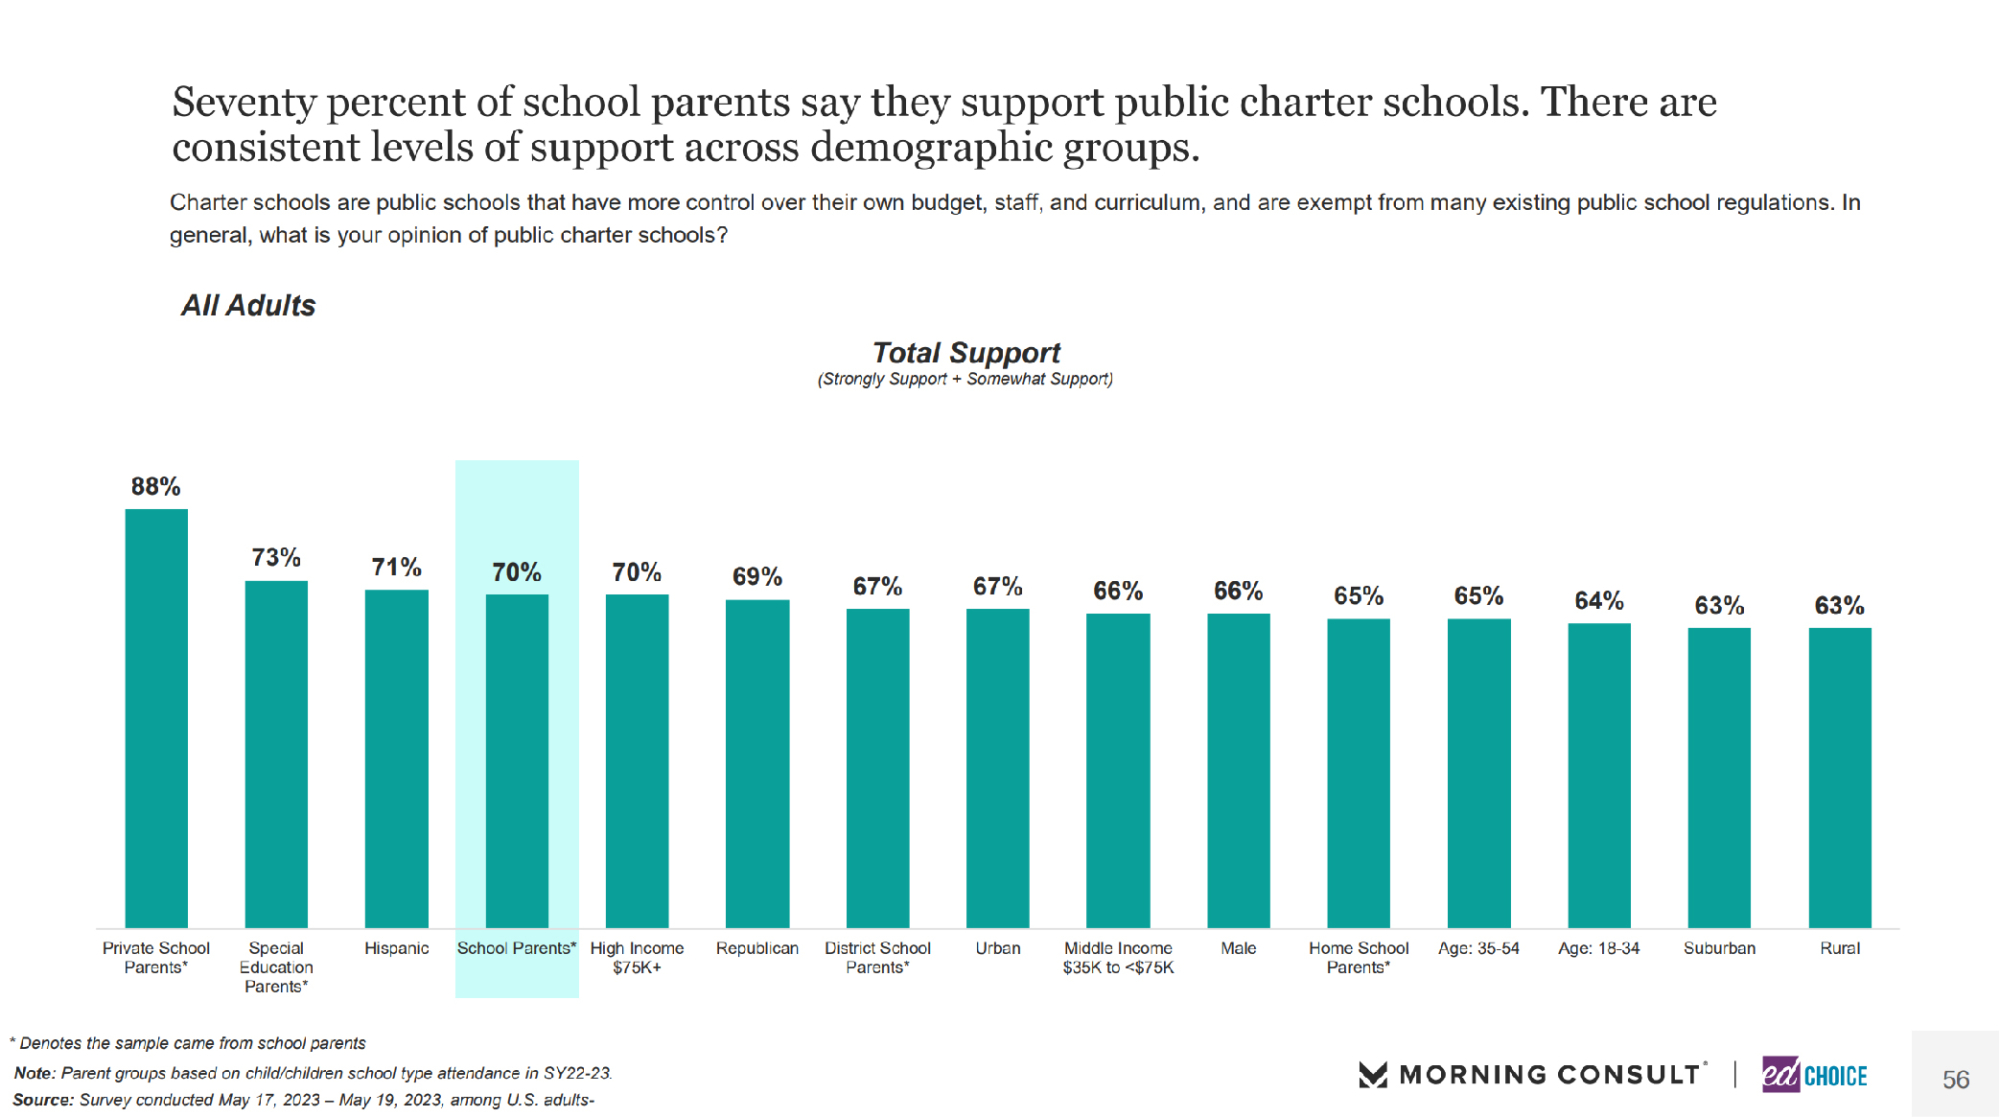
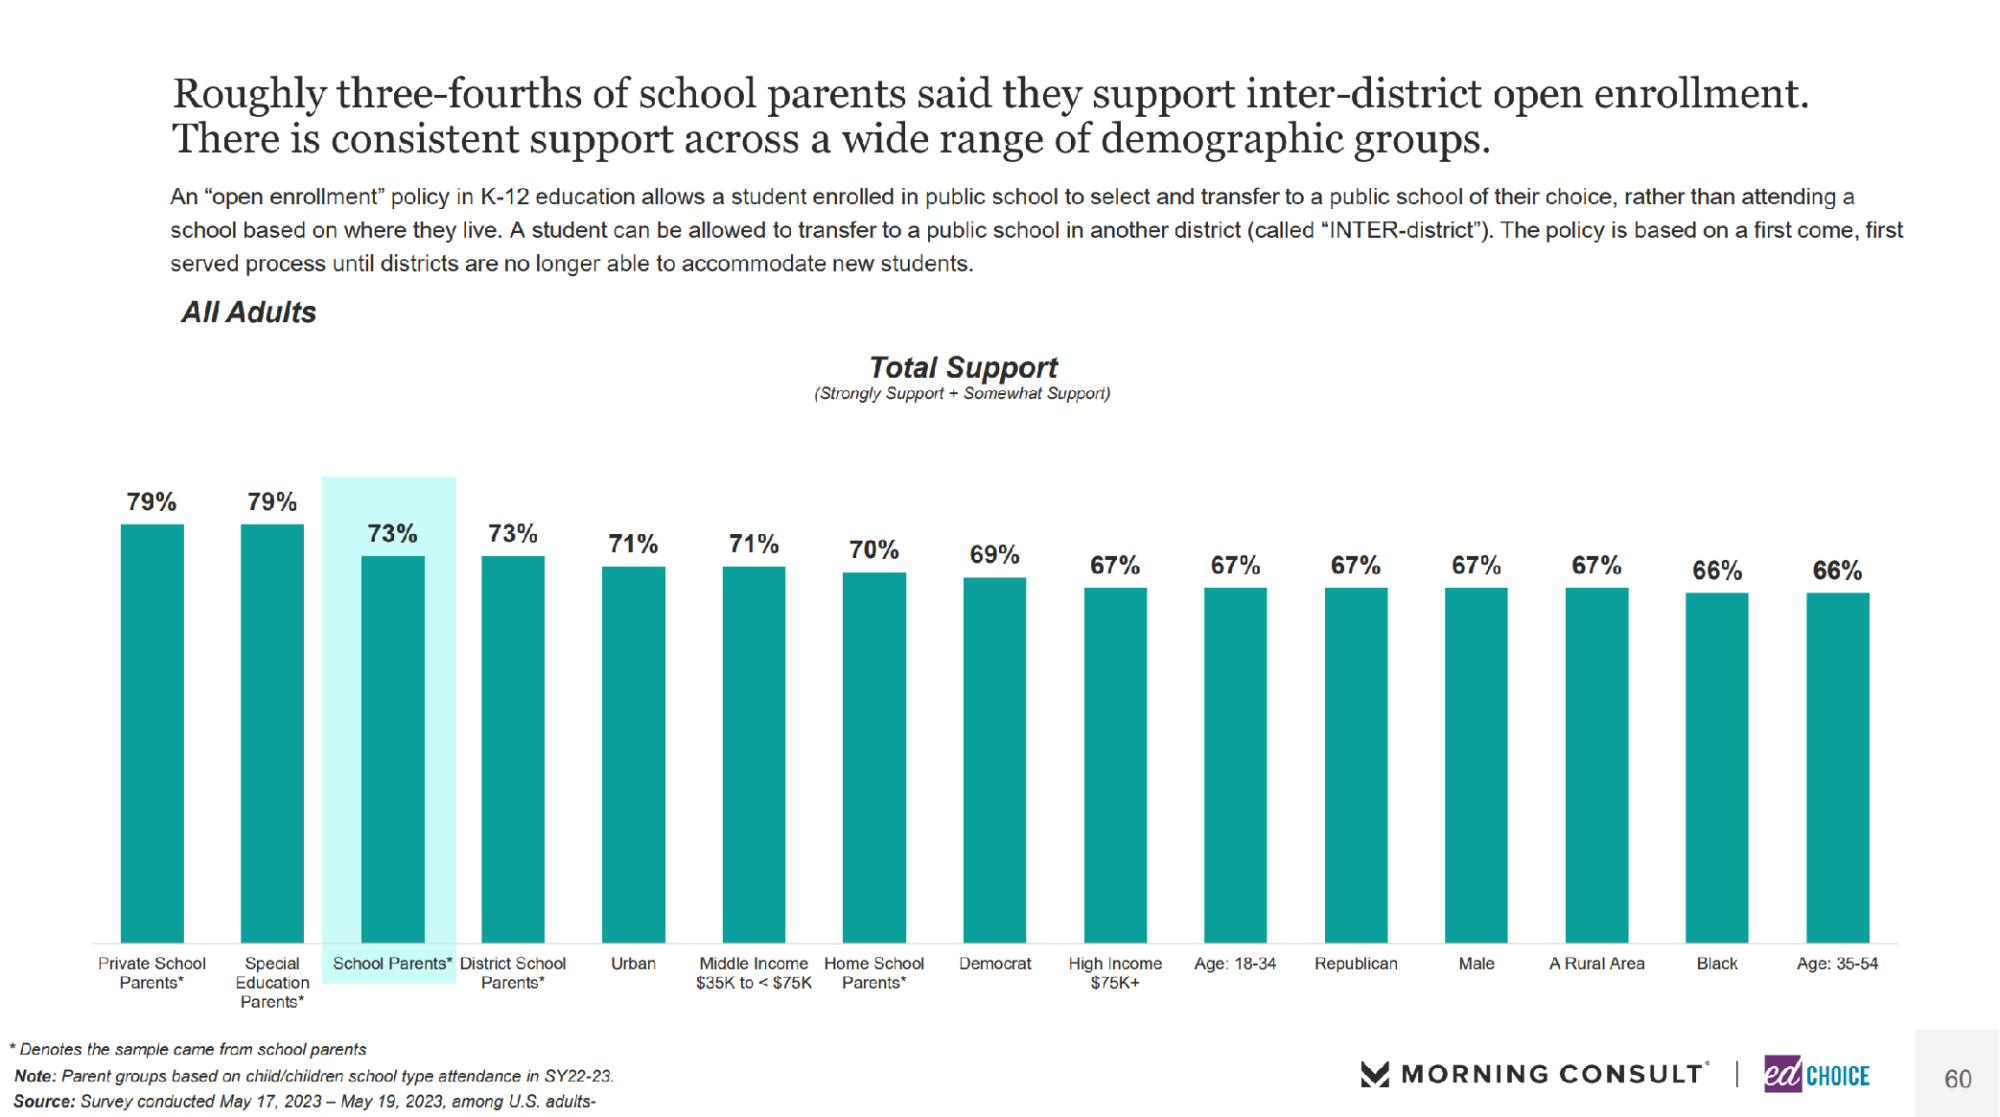
7. Overall support levels for school choice policies remain high among school parents and the general public, though support fell slightly in May. Americans’ support for ESAs (-3), vouchers (-4), charter schools (-2), and open enrollment (-3) slightly decreased in May, though support for each of these policies from the general public remains above 60 percent. In May, parents’ support for each of the school choice policies remained much higher than the general public. Support for each of these policies from parents is at least 70 percent, with ESAs continuing to be the most popular school choice option among parents at 76 percent.
Visit the EdChoice Public Opinion Tracker site to access past reports, crosstabs, and questionnaires. We update our national and state dashboards every month. We also provide a more in-depth description of our research and survey methods.
Our K–12 education polls archive is updated on a rolling basis, roughly a few times each month. Please don’t hesitate to let us know if we are missing any surveys, or if there are accidental errors.


