NEW RESEARCH: The Fiscal Effects of School Choice: The Costs and Savings of Private School Choice Programs in America through FY 2022
A new EdChoice report, The Fiscal Effects of School Choice: The costs and savings of private school choice programs in America through FY 2022, estimates the short- and long-term fiscal effects of 48 programs across 25 states. The analysis includes five education savings account programs, 22 school voucher programs, and 21 tax-credit scholarship programs. This report updates the previous version of EdChoice’s Fiscal Effects report from 2021, which analyzed 40 programs through fiscal year (FY) 2018.
The report uses short-run and long-run variable cost estimates to generate lower bounds and upper bounds of the fiscal effects of education choice program on taxpayers through FY 2022. Because this period pre-dates any universal or near-universal program getting up and running, the main analysis does not include such programs. Given growing interest among states in following the footsteps of others such as Arizona, Florida, Iowa, and West Virginia in creating broad-eligibility programs, however, the report includes a separate fiscal analysis of Arizona’s universal education savings account (ESA) program using state data from fiscal years 2023 and 2024.
To help readers consider concerns about potential adverse impacts of choice programs on school districts and state budgets, the report provides additional data and context on areas such as enrollment shares of choice programs versus public schools, state budget implications, and more.
Here are the key takeaways from the study:
- From their inception through FY 2022, the 48 school choice programs studied generated cumulative net fiscal benefits for state and local taxpayers combined ranging from an estimated $19.4 billion to $45.6 billion. Since all programs analyzed had been operating for over five years by FY 2022, the fiscal benefits are likely closer to the high-end estimate of $45.6 billion.
- On a per-student basis, these cumulative net fiscal benefits equate to $3,300 to $7,800 per program participant.
- Put another way, states experienced fiscal benefits worth an estimated $1.70 to $2.64 for every dollar spent on a school choice program.
- On average, if at least 56% of students who participate in choice programs switched from public to private schools, these programs saved taxpayer dollars overall. For programs that have been in operation a long time, this break-even rate may be as low as 37%. These break-even switcher rates are significantly lower than switcher rates observed in random assignment studies (85% to 90%, on average) and imply significant savings from choice programs.
These savings result from many of the students who exercised choice who would have been enrolled in a public school if these choice programs did not exist—and would have enrolled in public schools at a much larger taxpayer cost.
The fiscal benefits generated by school choice programs occur for several reasons:
- Funding gaps between school choice programs and traditional public schools are large. Public schools cost an average of over $17,000 per student annually, while the average cost to taxpayers for students in school choice programs is approximately $6,000 — about a third of the cost of public schools.
- While there are some fixed costs in the short run, districts also experience lower variable costs when enrollment declines. As time goes on, districts eventually can adjust their operations and budgets fully to a change in enrollment. Thus, savings grow over time.
- By reducing the number of students in public schools, choice programs can alleviate overcrowding, potentially avoiding the need for costly expansions and additional personnel and equipment.

Despite these cost differences, critics argue that choice programs will dismantle public education by shifting large numbers of students into private schools. However, the data tell a different story. Choice programs enroll just 2.4% of all publicly funded K–12 students. At the same time, just 1% of all public funding for K–12 public education flows to choice programs. Thus, when students migrate from public schools to other nonpublic educational settings via choice programs, fiscal benefits accrue to state and local taxpayers and provide an impressive return on investment.


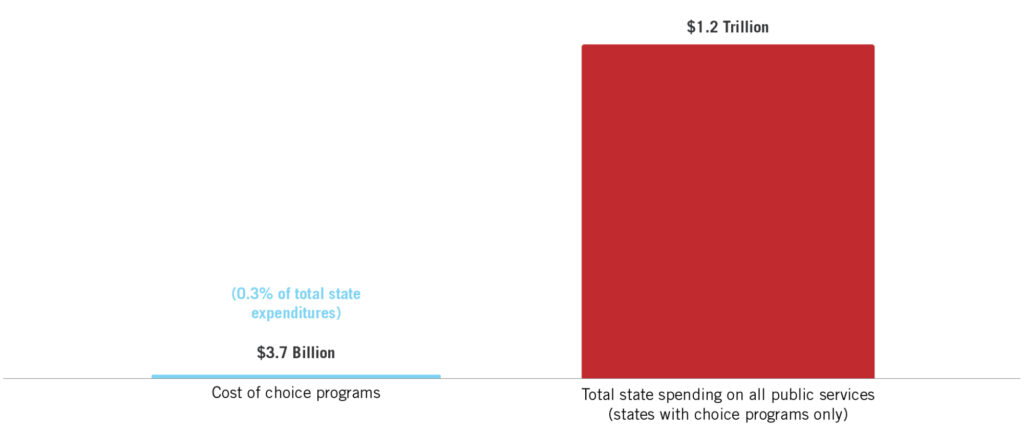
In recent years, critics levied a new argument against choice programs—that these programs are causing “budget meltdowns.” What does that look like? In FY 2022, private school choice programs accounted for 0.3% of total state expenditures on all public services in states where choice programs exist. That’s just a tiny fraction of the one trillion dollars in state expenditures on all public services.
Figure: Total Cost of Choice Programs and Total State Spending on All Public Services in States Operating Choice Programs
Fiscal analysis of a universal ESA program: Arizona
Recent reports have claimed that the ESA program in Arizona led to a “budget meltdown” in the state. Spending on the program in FY 2024 was $730 million, causing an outcry among critics. Once again, putting the program’s cost in the context of the state’s budget reveals that this amount represents just 0.9% of total state expenditures on all public services.
By the way, the ESA expansion coincided with a $2 billion budget surplus, but we’ll let readers decide for themselves if this construes a “budget meltdown” caused by choice. More on “the Arizona problem” can be found here and here.
Figure: Total Cost of Arizona ESA Program and Total State Spending on All Public Services in Arizona

But this claim looks at only one side of the fiscal coin. Critics fail to account for potential savings from students who are diverted from public schools, which is what any proper fiscal analysis should account for. The report offers some guidance for how government and other administration agencies can improve data collection about this group of students in order to provide policymakers with a more accurate understanding of universal choice programs and improve fiscal analyses of these programs.
Using data from the Arizona Department of Education to estimate switcher rates, the analysis estimates a net cost of $37million in the short run. What does that look like in the context of the state’s budget? It represents 0.2% of taxpayer support for K–12 public schools and only 0.05% of total state expenditures on all public services.
In the long run, the analysis projects that the current cohort of students in Arizona’s ESA program will yield net fiscal savings of $244 million annually. These results are a far cry from the decimation of the state’s budget levied by critics.
Policymakers should note that these fiscal effects ignore any indirect economic benefits that choice offers, such as lowering crime rates and improving longer term outcomes by reducing high school dropout rates and boosting post-secondary outcomes.
Given these findings, policymakers considering introducing or expanding choice programs can be assured that doing so will not financially harm public schools and will likely serve as a rising tide that lifts all boats, benefitting students in their state for generations to come. The evidence is clear: taxpayers benefit, school districts adapt well, and students—both in and out of choice programs—experience better outcomes.