EdChoice Public Opinion Tracker: General Population and School Parents – January 2023
What a difference a year makes. In the early days of 2022, schools wrestled with the Omicron variant of COVID-19. Fortunately, the beginning of 2023 yielded much brighter news with states like Iowa and Utah recently passing expansive school choice bills to give families in their states more options in their child’s education. All signs point to more states following their lead in the near future. With this exciting news it is tempting to get ahead of ourselves and start to speculate on what the education landscape will look like further down the road. Before that, let’s take the pulse of Americans and school parents to better understand today’s education scene.
In partnership with Morning Consult, EdChoice surveyed a nationally representative sample of American adults 18 and older (N=2,200) from January 6-9, 2023. With additional sampling, we obtained responses from 1,060 parents of children currently in K-12 education. This month we featured new questions diving into microschooling and communication levels between parents and teachers. Additionally, we got fresh data on all things school choice. The full report can be found here.
Let’s jump into the top takeaways from the January edition of our public opinion tracker:
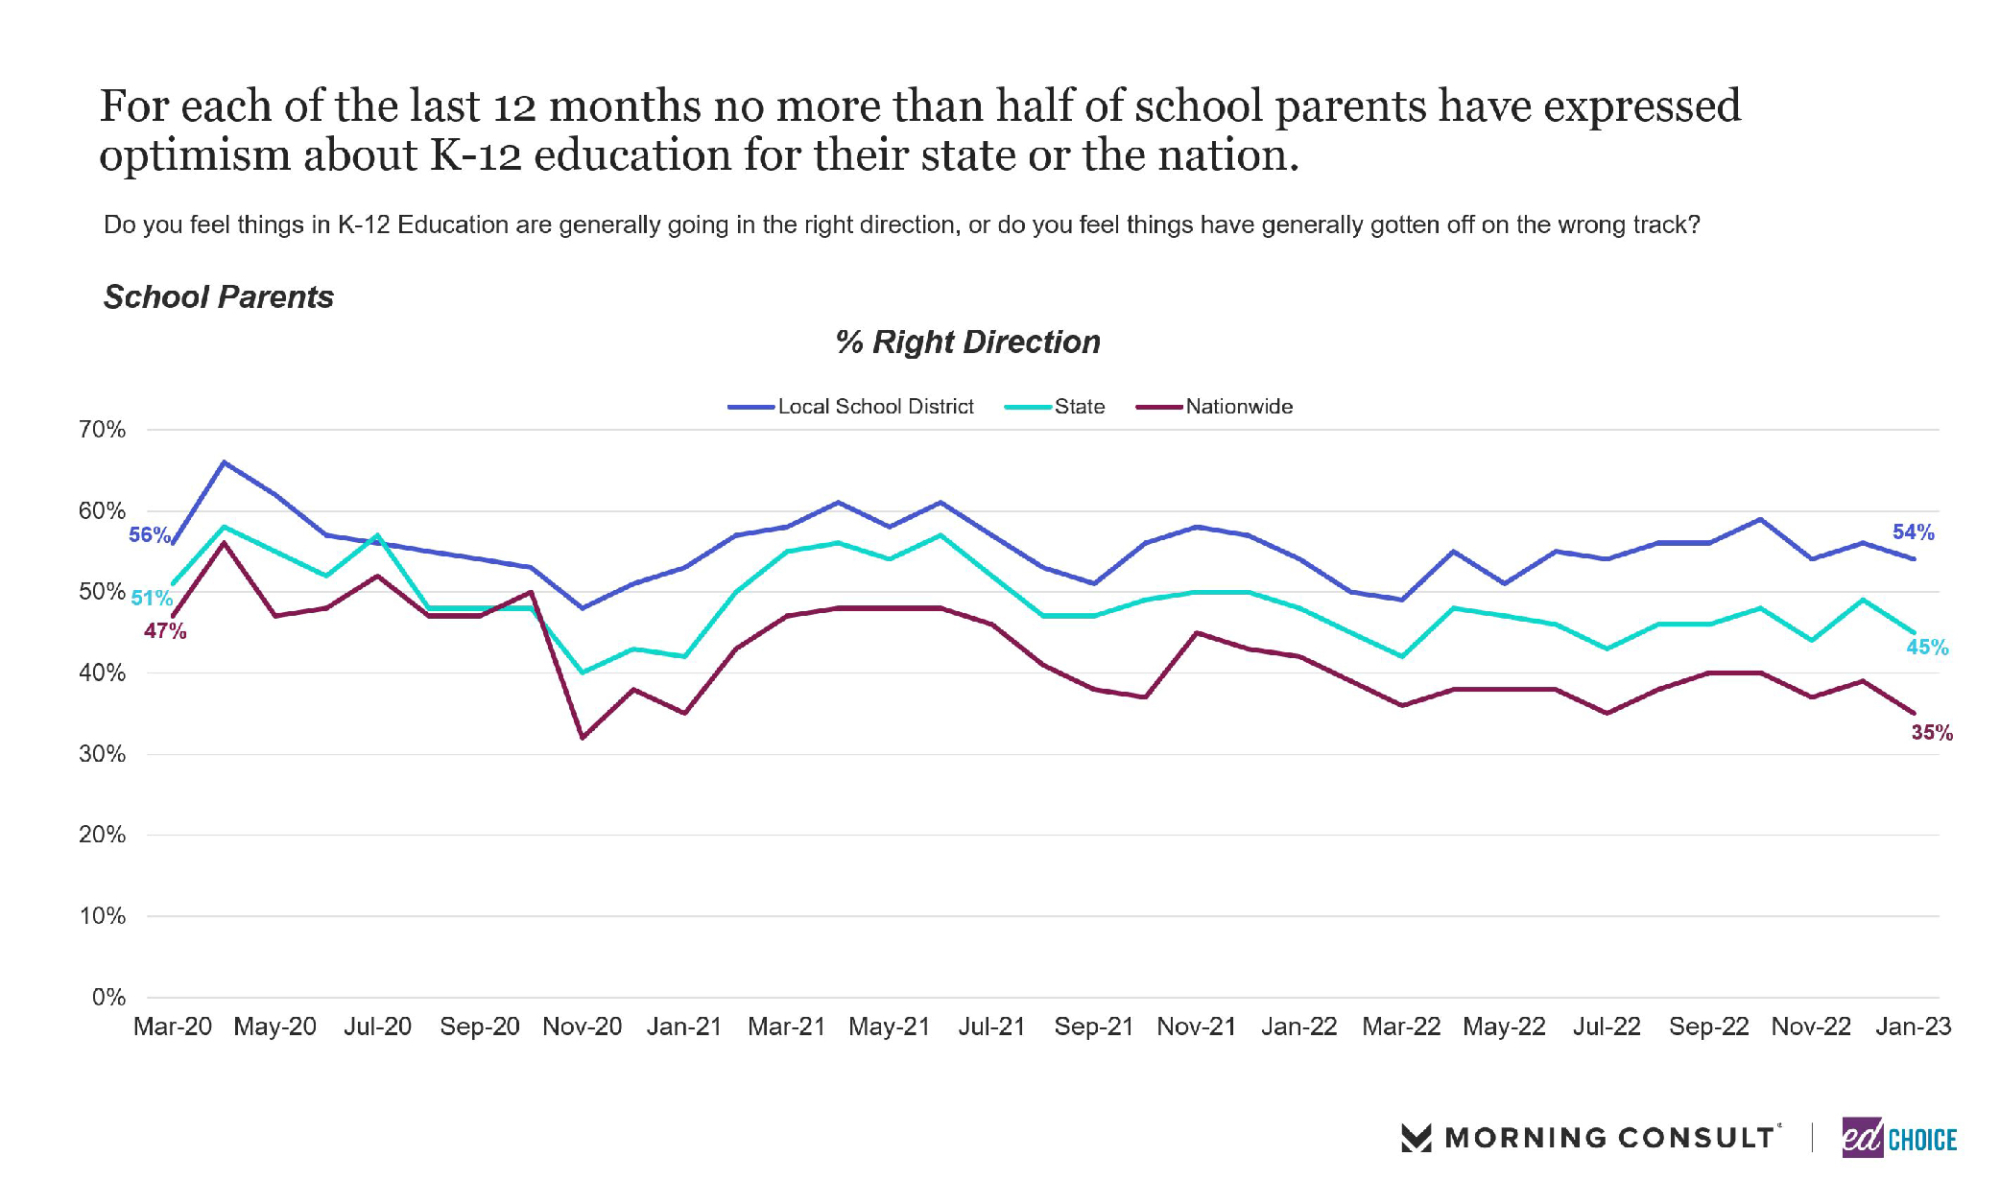
1. In January, parents were more pessimistic towards the direction of K-12 education. When asked “Do you feel things in K-12 Education are generally going in the right direction, or do you feel things have generally gotten off on the wrong track?” in December of 2022, the proportion of parents who believed K-12 education was going in the right direction reached one of the highest levels observed over the entire year. However, this month parents were more pessimistic discussing K-12 education across local, state, and national levels. Parents feel most optimistic about K-12 education at a local level, with more than half of parents saying it is on the right track (54%). K-12 education at a state and national level garner a bit less optimism from parents, as only 45 percent and 35 percent of parents believe K-12 education is going in the right direction, respectively.
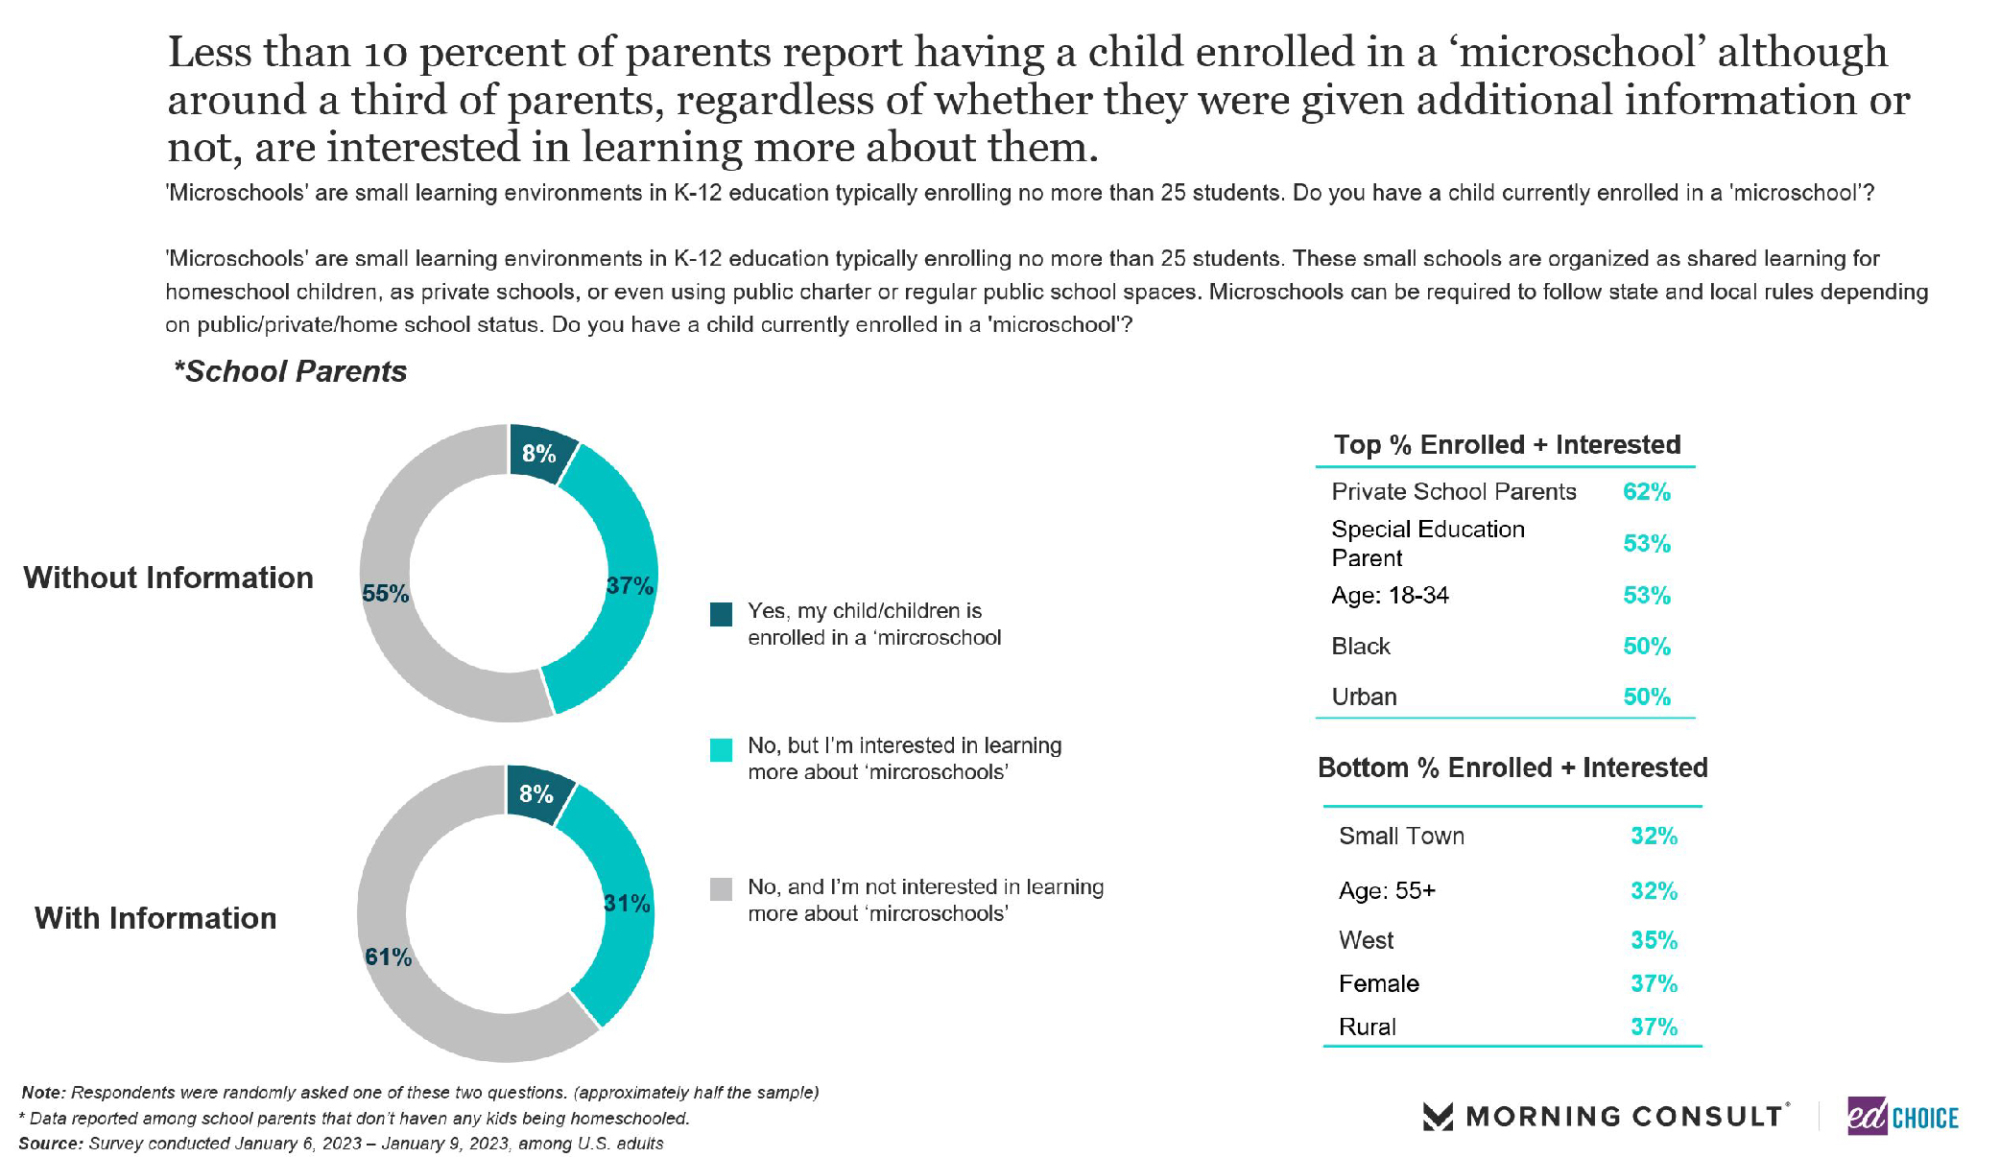
2. More families may be microschooling than we originally thought. For the first time in our polling, we asked the following question about microschools: “’Microschools are small learning environments in K-12 education typically enrolling no more than 25 students. These small schools are organized as shared learning for homeschool children, as private schools, or even using public charter or regular public school spaces. Microschools can be required to follow state and local rules depending on public/private/home school status. Do you have a child currently enrolled in a microschool?” We posed this as a split sample question, where some of the respondents got a similar question without giving the definition of a microschool. Regardless of whether respondents were given the definition of a microschool, 8 percent of parents reported their child being enrolled in a microschool, and roughly one-third of parents are interesting in learning more about microschools.
The demographic breakdown shines more light on the subject. The most likely groups to be interested in or have already enrolled their child in a microschool were private school parents (62%), special education parents (53%), as well as younger parents (age 18-34) (53%). Additionally, roughly half of black parents and parents from urban communities were interested in or have already enrolled their child in a microschool.
Back in September, my colleagues Paul DiPerna and Mike McShane used the little data available to estimate a range of two to four percent of American school children enrolled in microschools. If these survey findings are true, that would mean that many more students are in microschools than previously thought. We’re not quite ready to make that claim just yet. We’re going to keep experimenting with different wording of the question to make sure that this number is not an artifact of how we ask the question instead of the actual underlying reality.
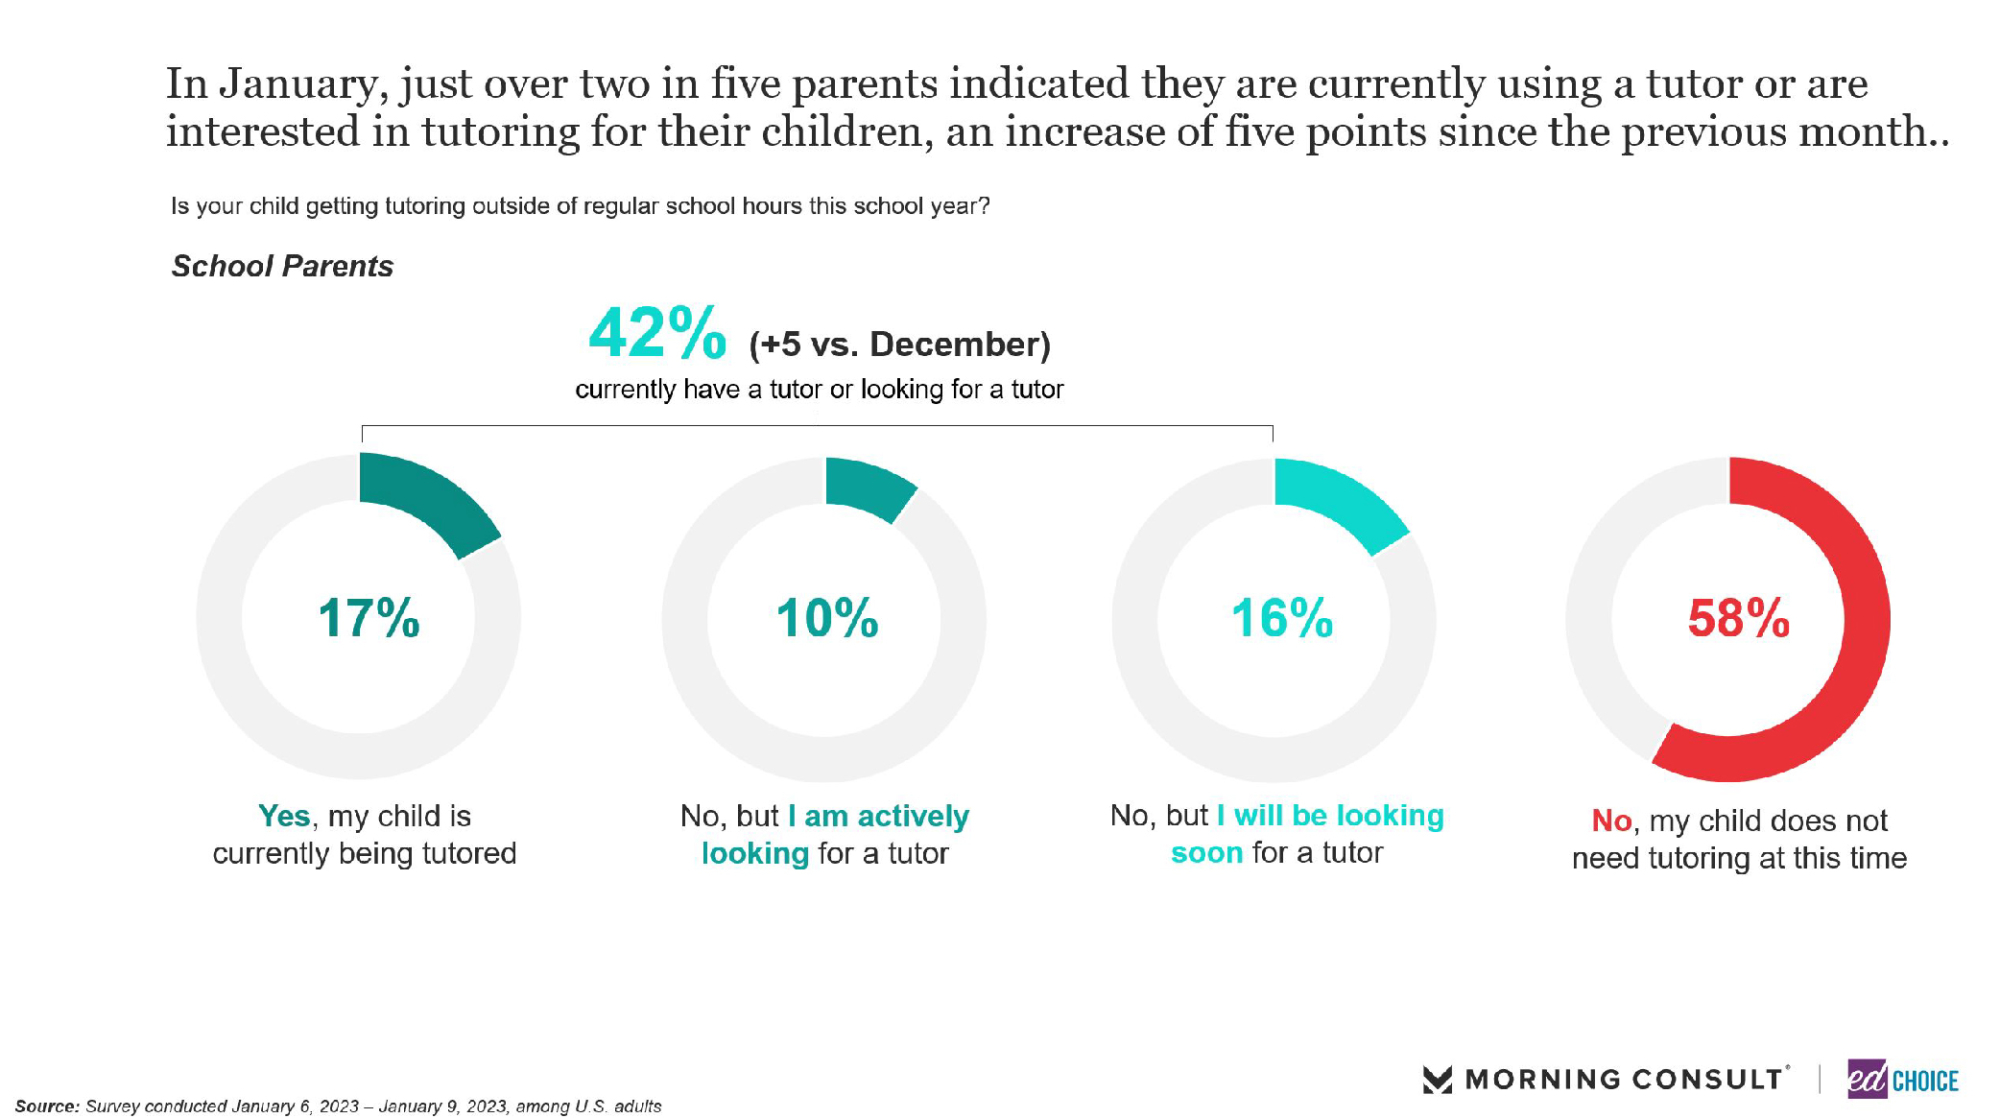
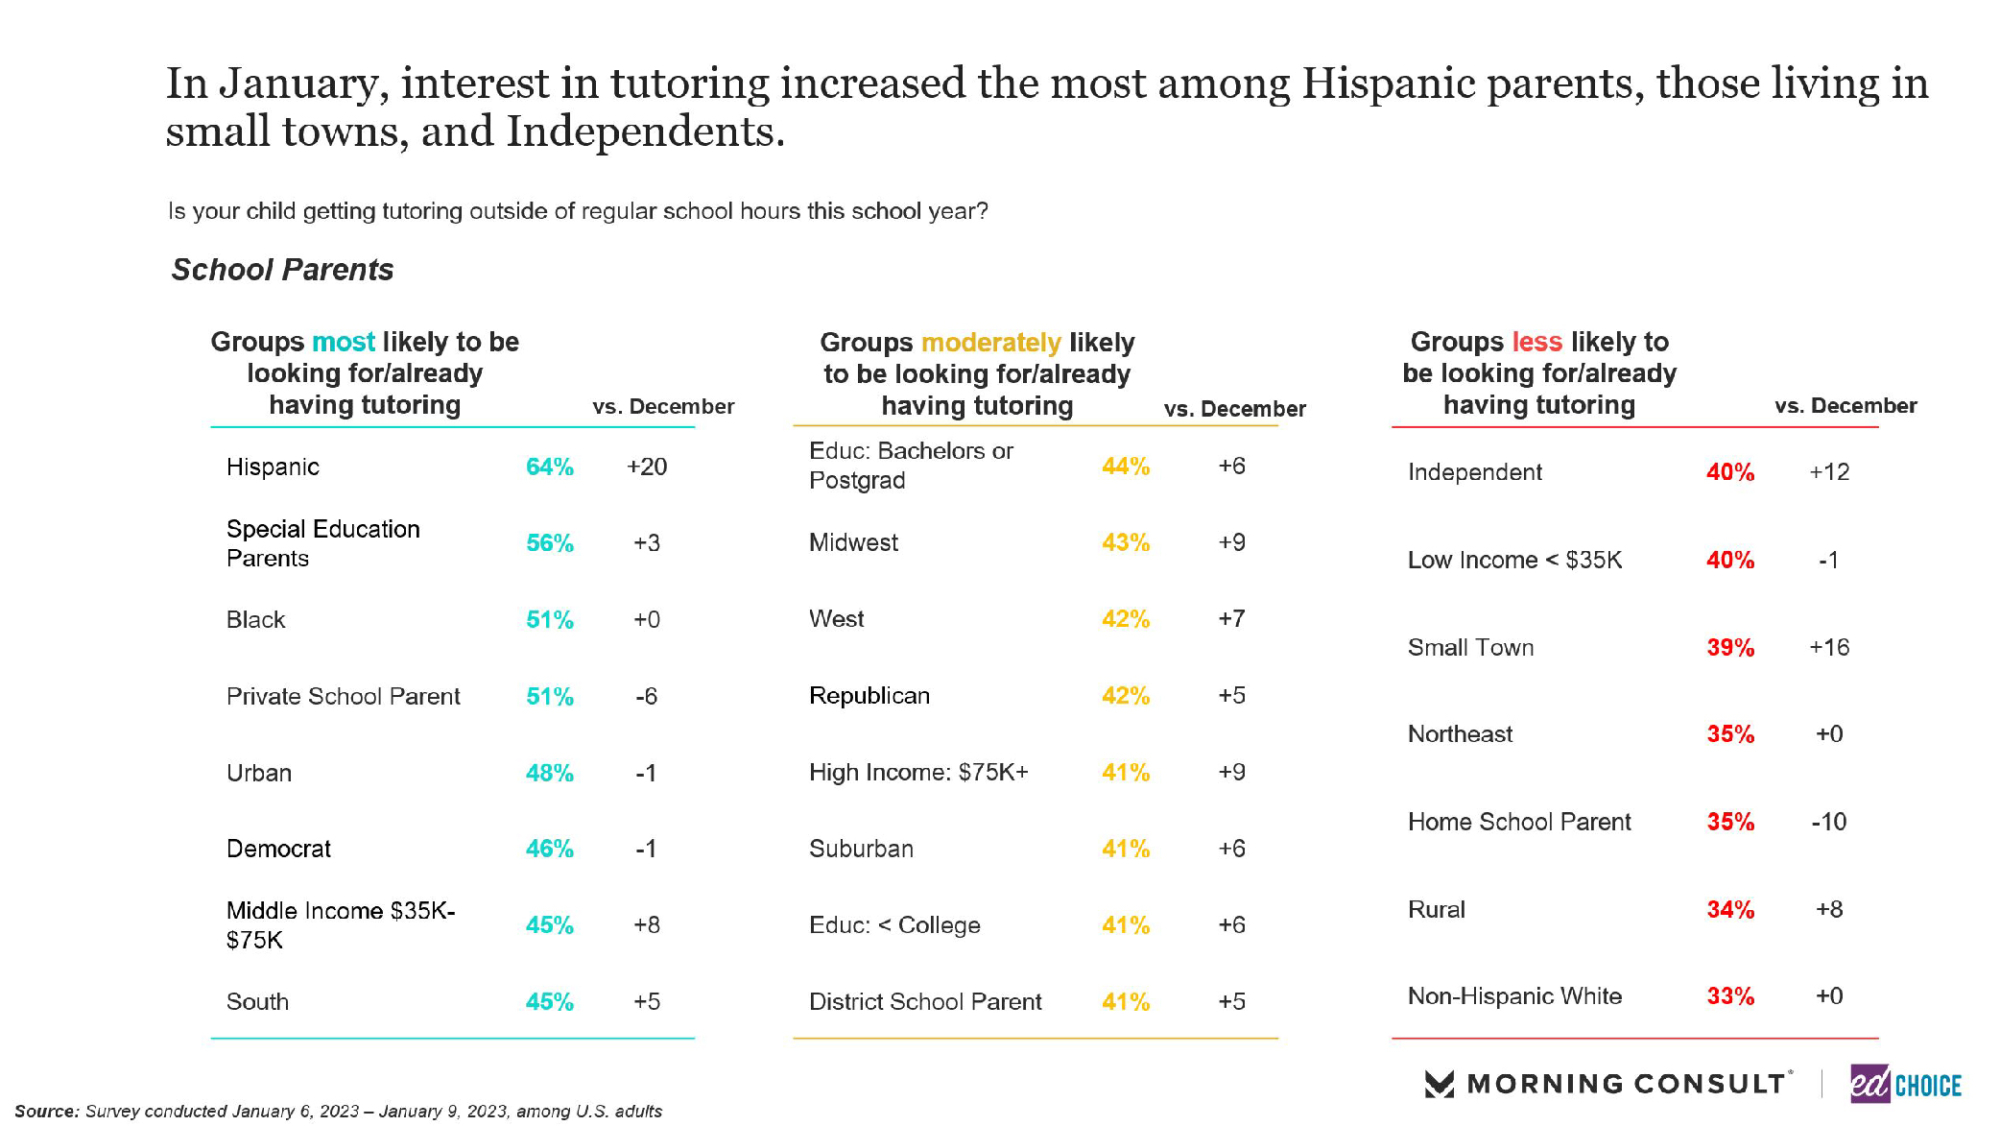
3. More than two in five parents report currently using a tutor or are actively looking for a tutor for their child. The proportion of parents using or looking for a tutor increased 5 points since December, returning to the same level of interest seen in the fall of 2022. Hispanic, special education and black parents were the most likely demographic groups to report interest in tutoring. Hispanic parents, independent parents, and small-town parents saw a significant rise in tutoring interest from December – increases of 20 points, 12 points, and 16 points, respectively. The average monthly price parents were willing to pay for tutoring was roughly $300 per child.
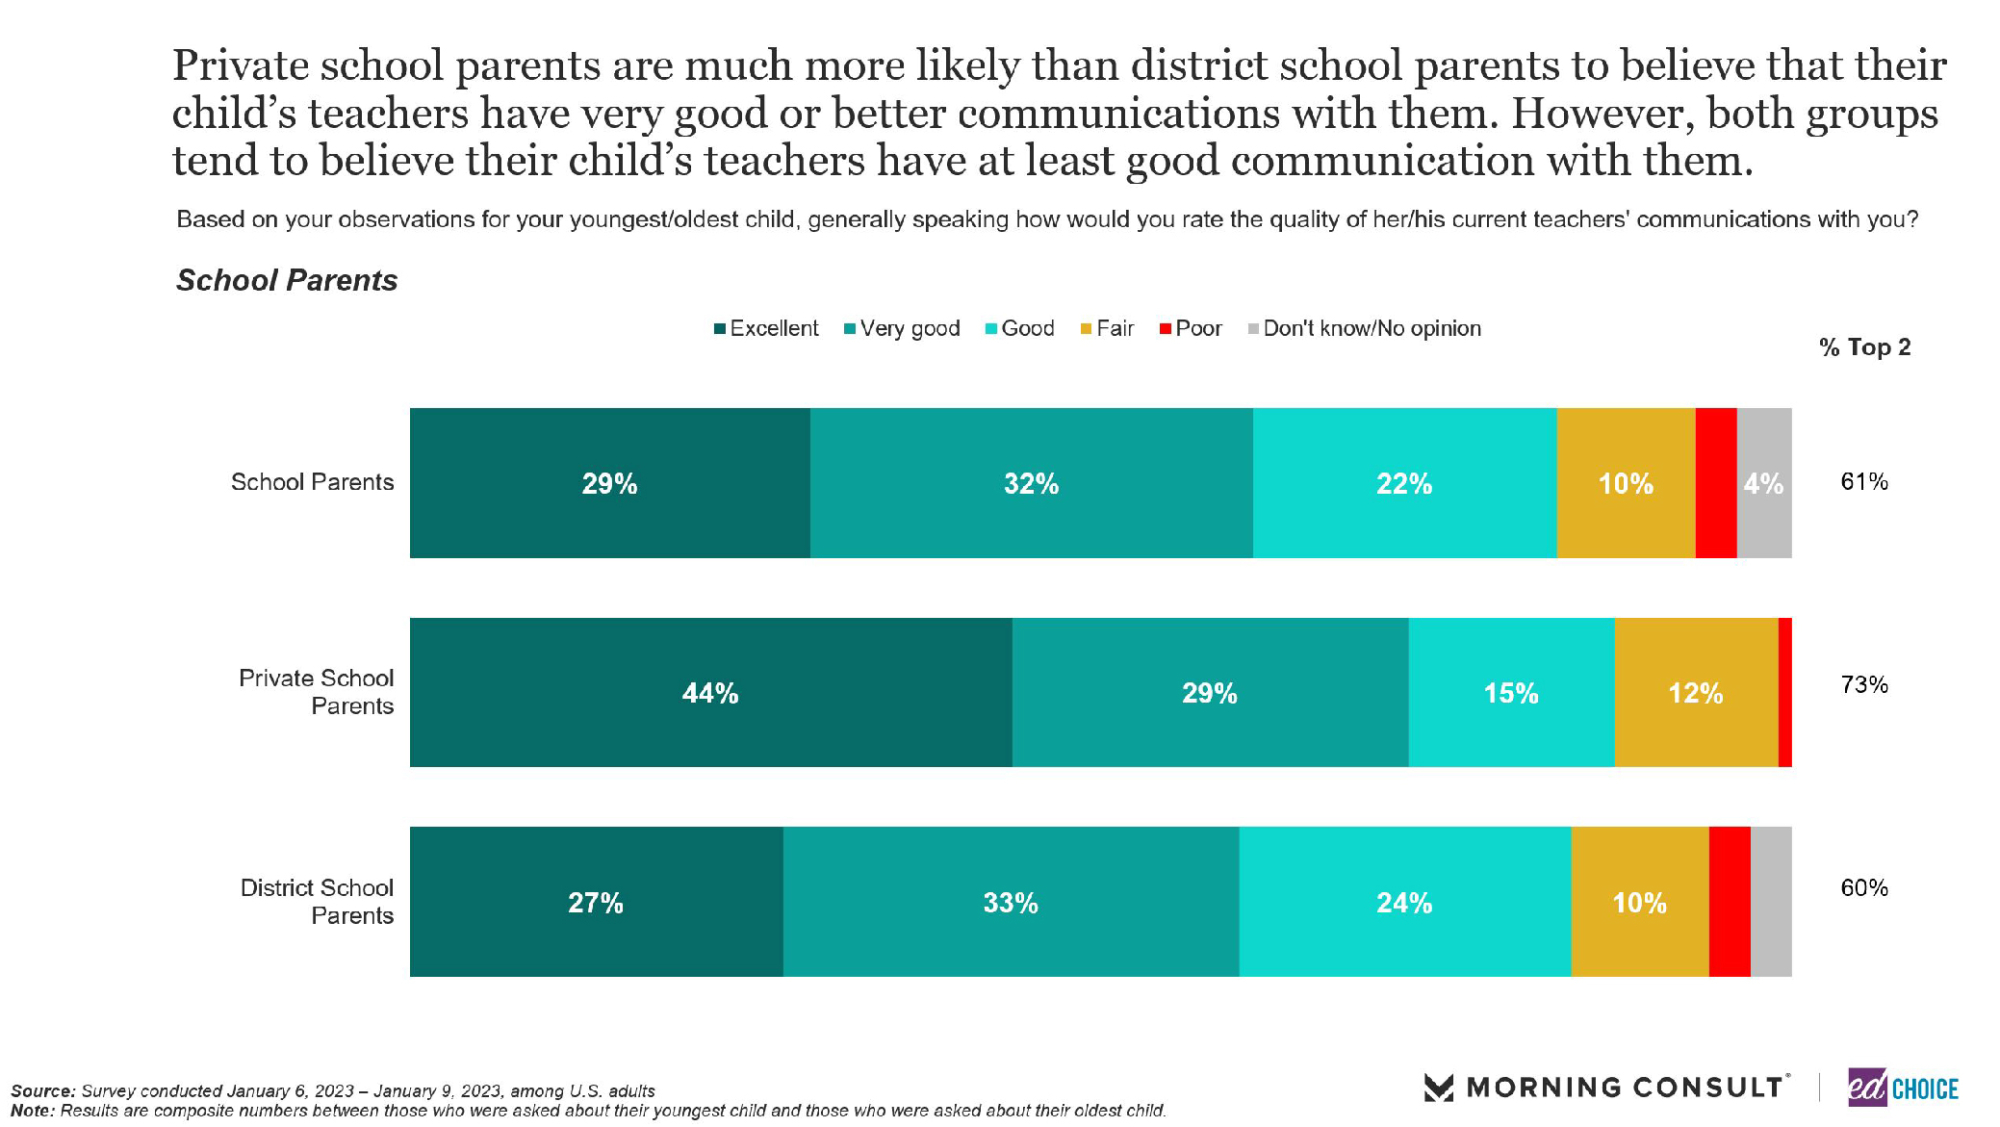
4. The majority of parents feel their communication with their child’s teacher is good. For the first time, we asked parents to describe their communication with their child’s teacher. Both private (88%) and district school parents (84%) believe their child’s teachers are at least good at communicating with them. Nearly 75 percent of private school parents would say their communication with their child’s teacher is excellent or very good. Three in five district school parents would say the same for their communication with their child’s teacher.
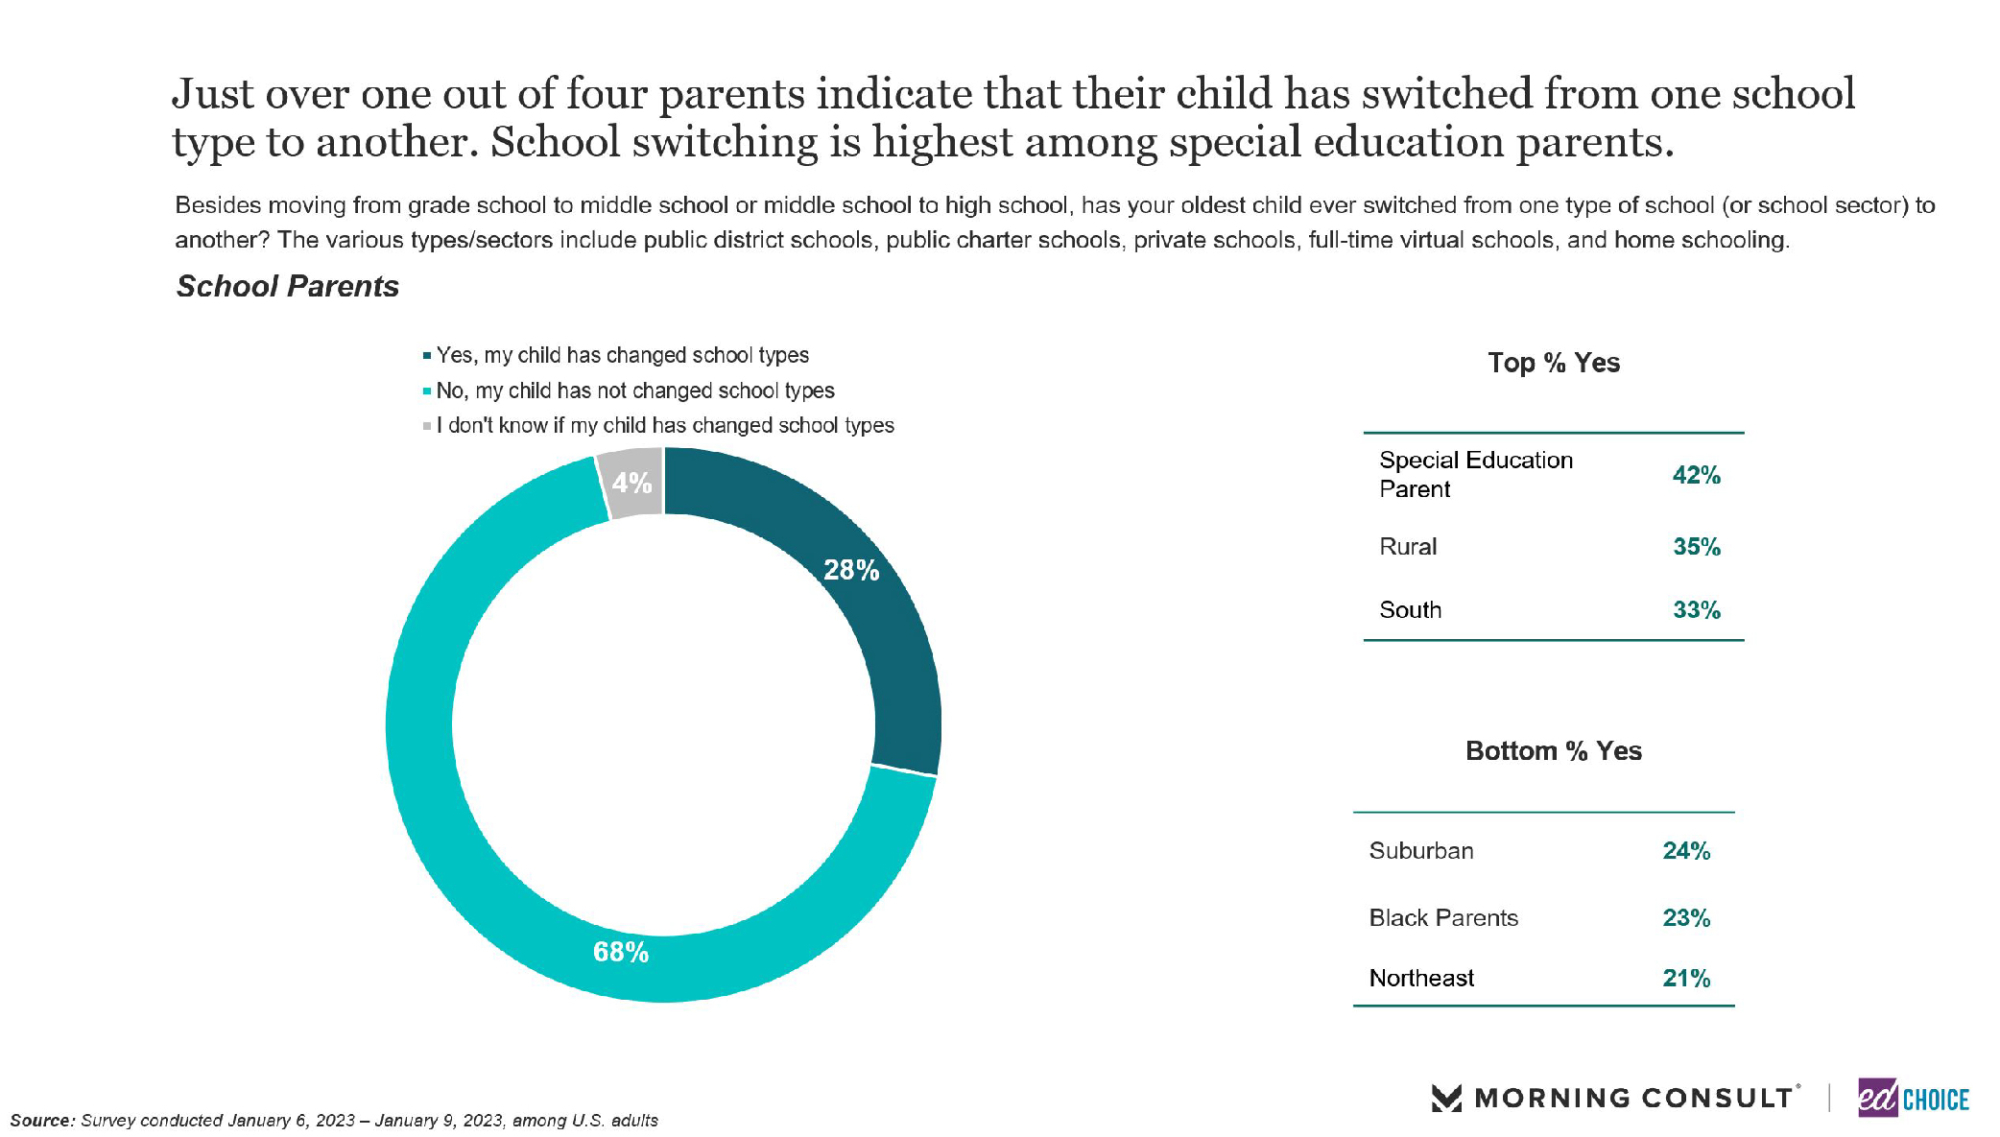
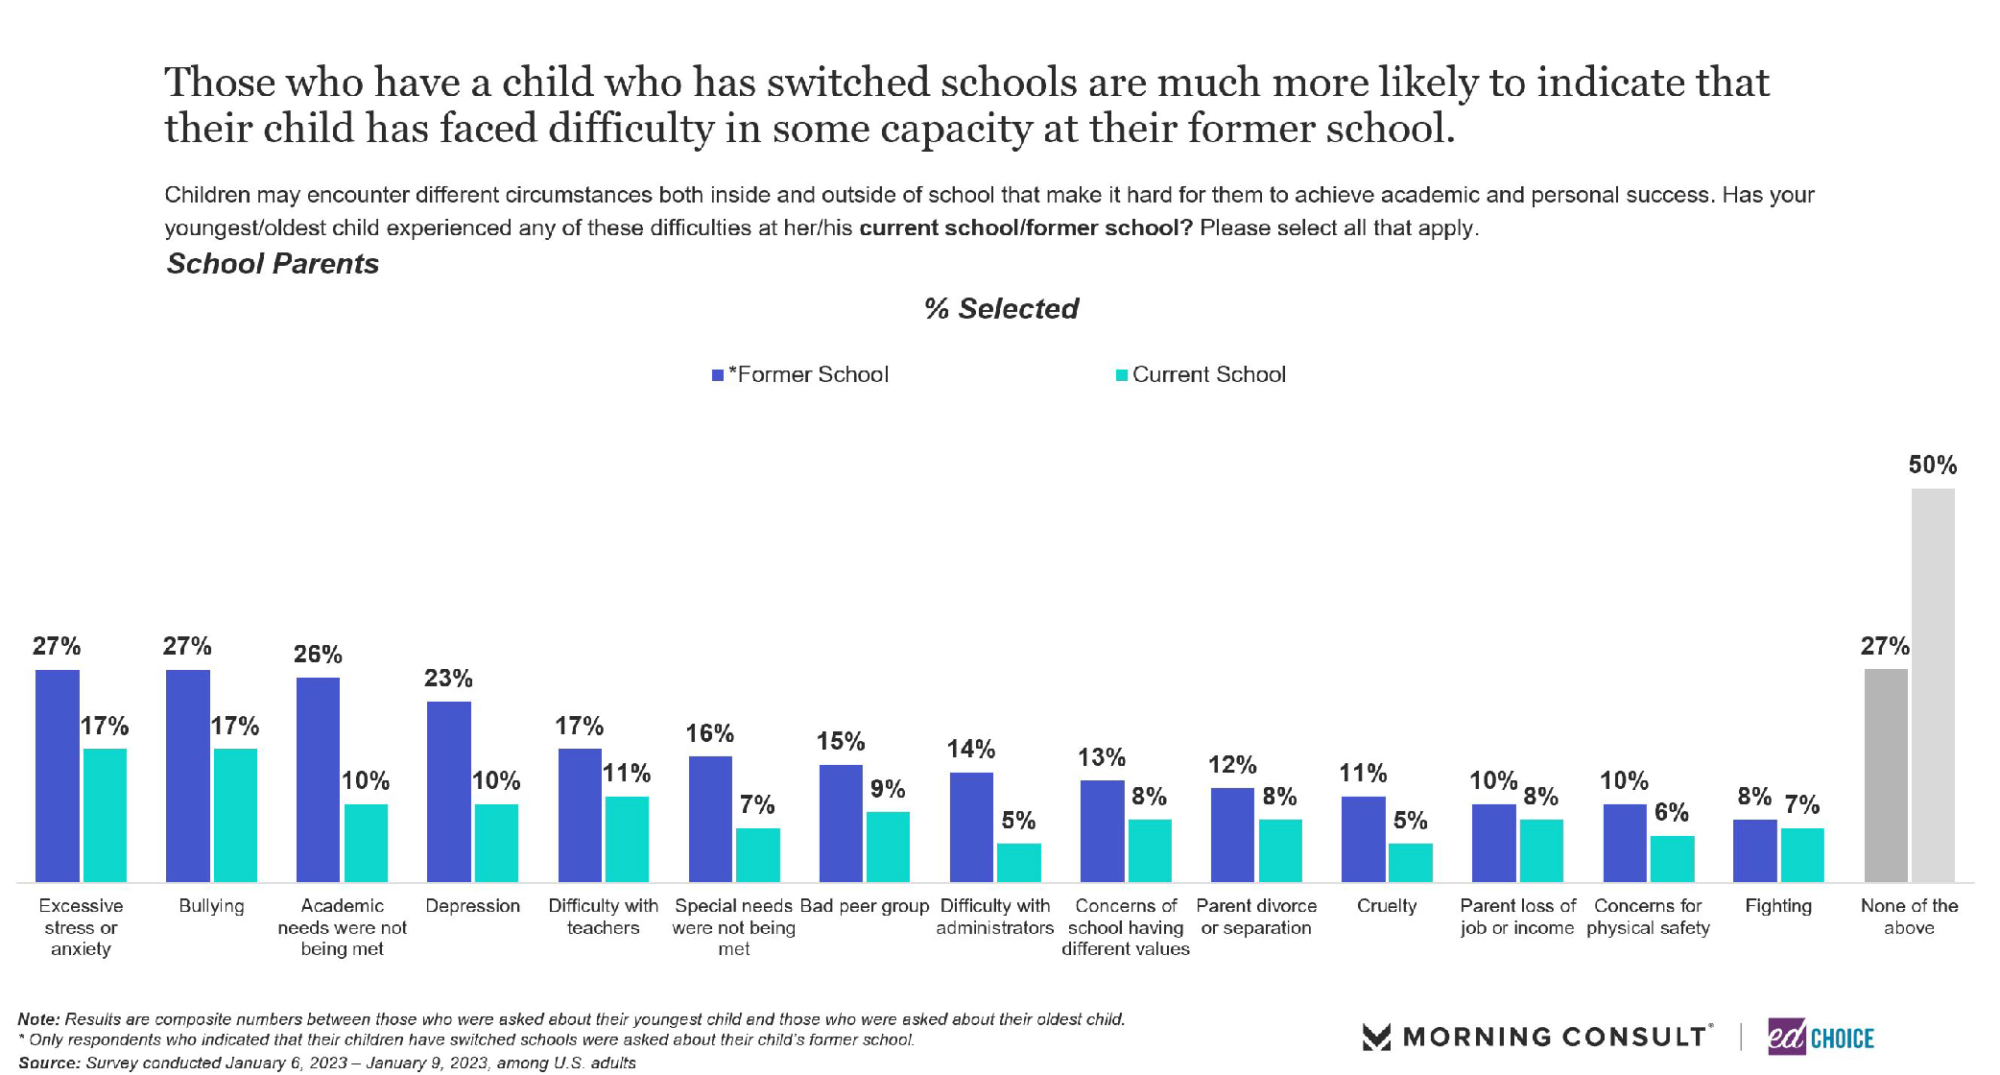
5. Just over one in four parents report their child has switched from one school type to another. Disregarding moving from grade school to middle school or middle school to high school, 28 percent of parents say their child has switched from one type of school to another during their academic career. Special education parents, parents from rural areas, and parents residing in the south are the most likely groups to report their child switching school types. Excessive stress or anxiety, bullying, and academic needs not being met were the most popular reasons for children switching school types. Parents were less likely to report that their child is still facing those difficulties at their current school.
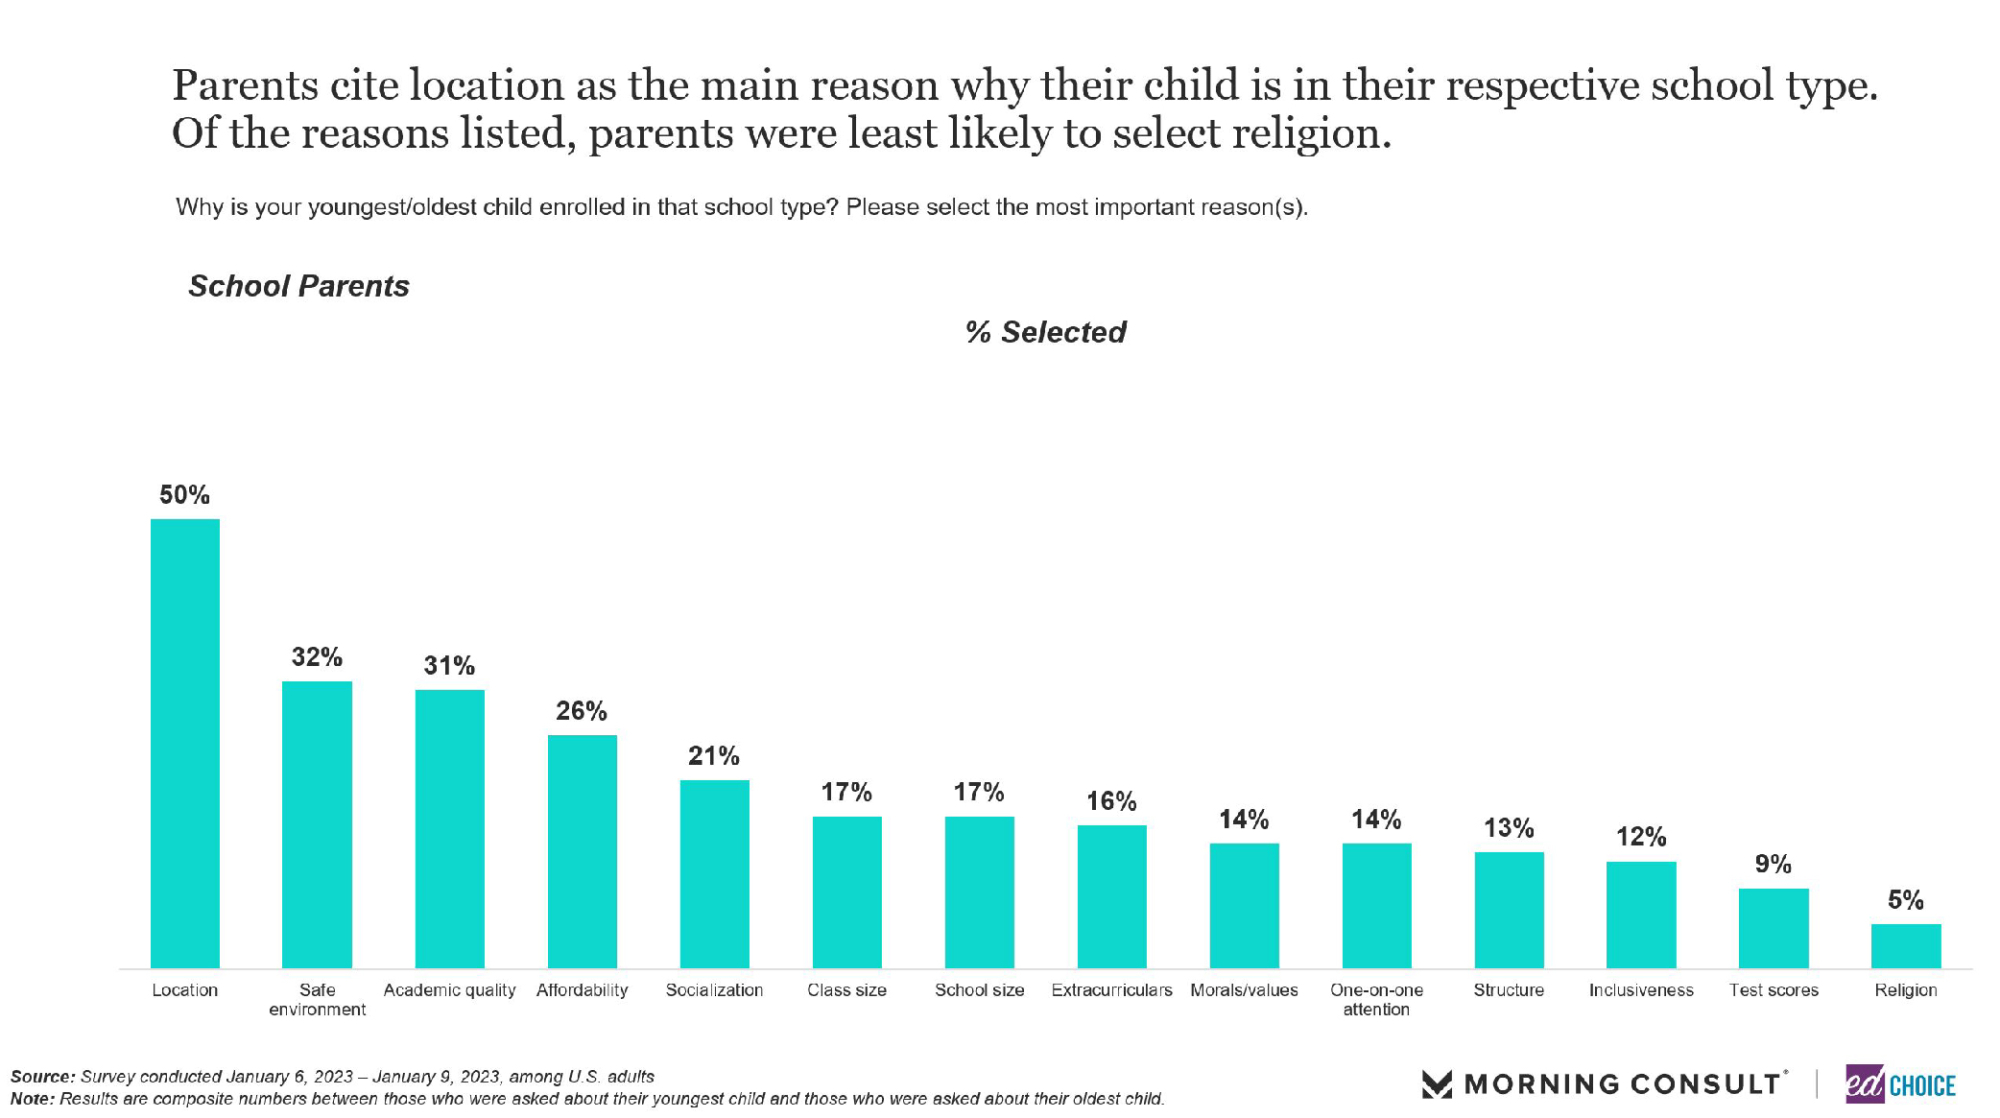
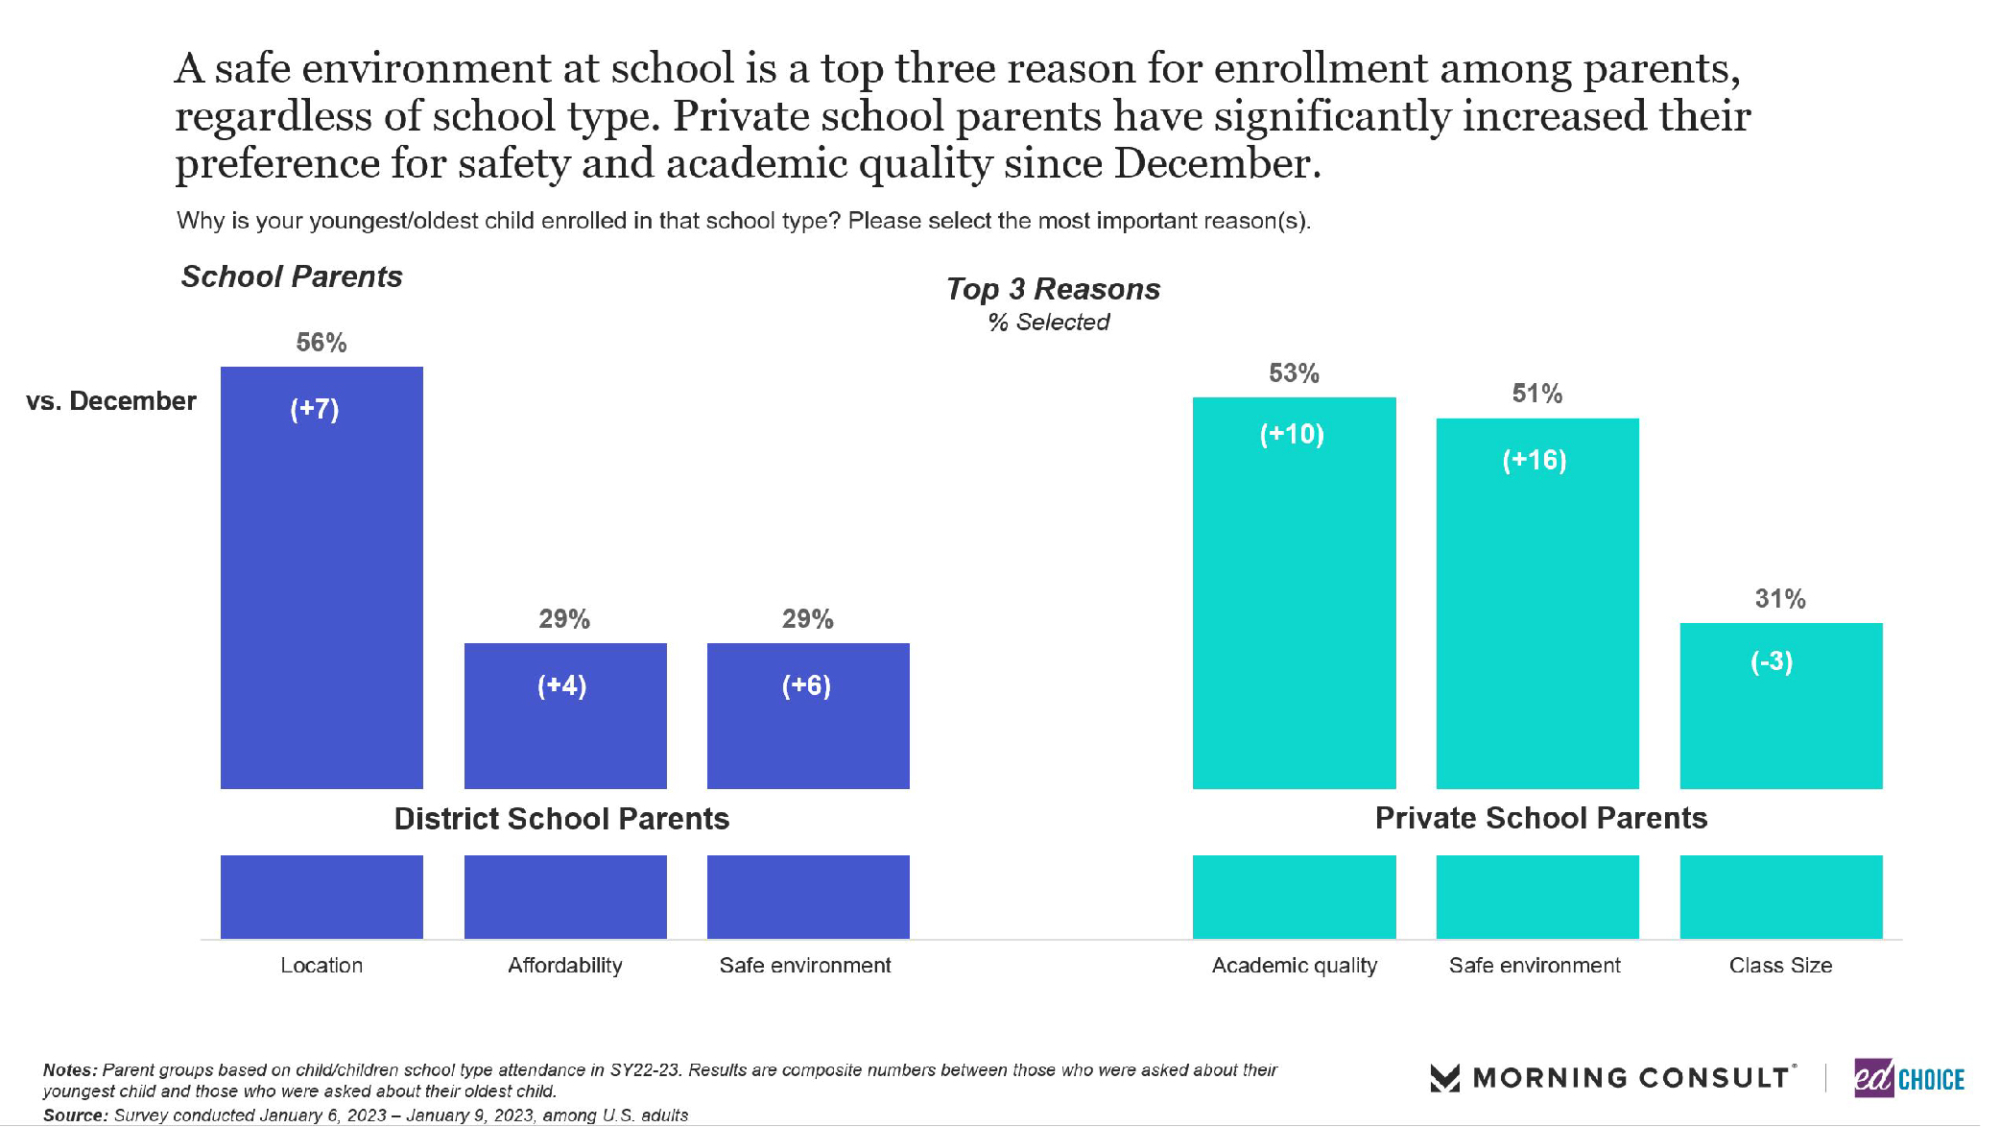
6. Location, safe environment, and academic quality remain the top reasons parents enrolled their children in their school. We asked parents to identify their top reasons for why they enrolled their child in a certain school type. Location was the main reason, cited by roughly half of the parents in our poll. Roughly one-third of parents listed safety and academic qualities as their top priorities for their child’s school. We looked at the difference in priorities between private school and district school parents as well. Ensuring a safe environment and academic quality were the top two motivators for private school parents. District school parents also had a safe environment in their top priorities, but location was the top influencer by a large margin.
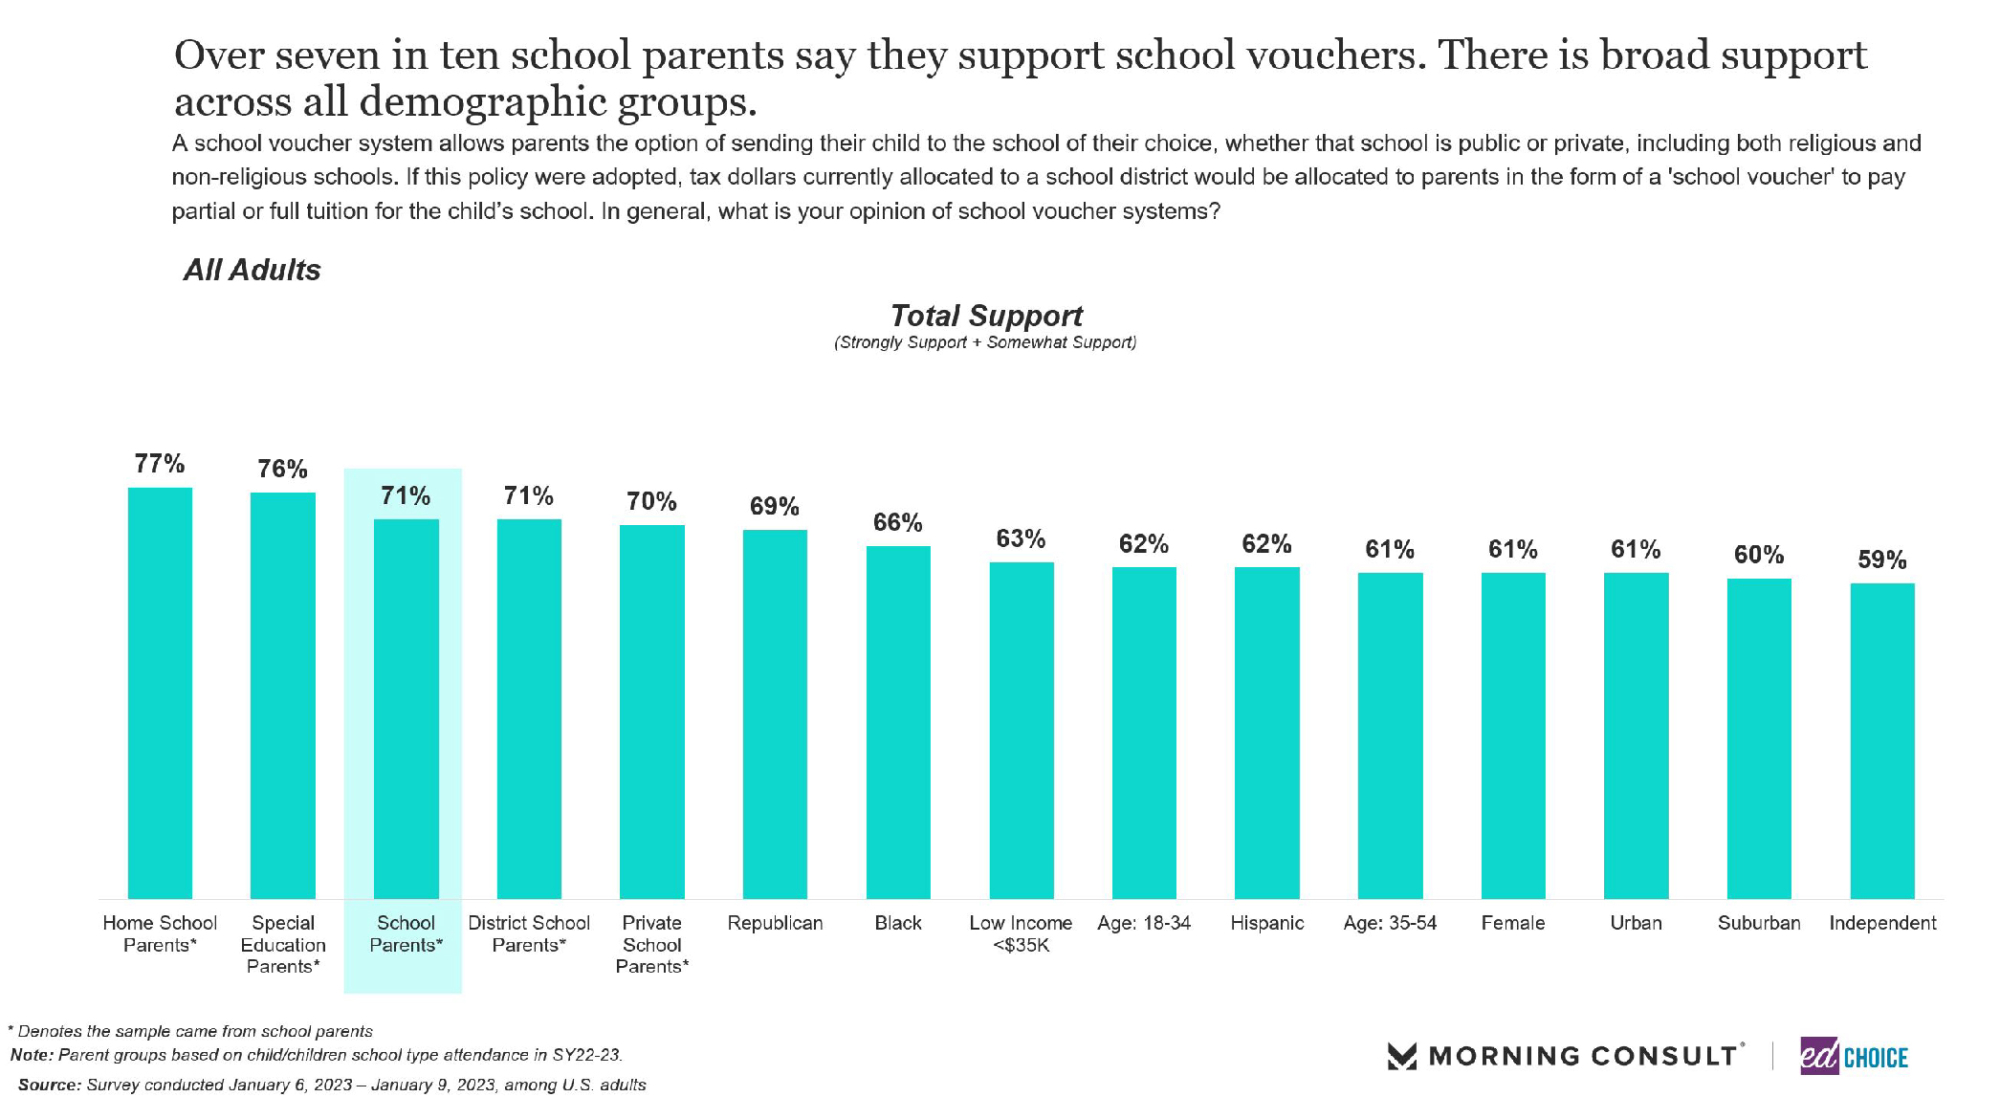
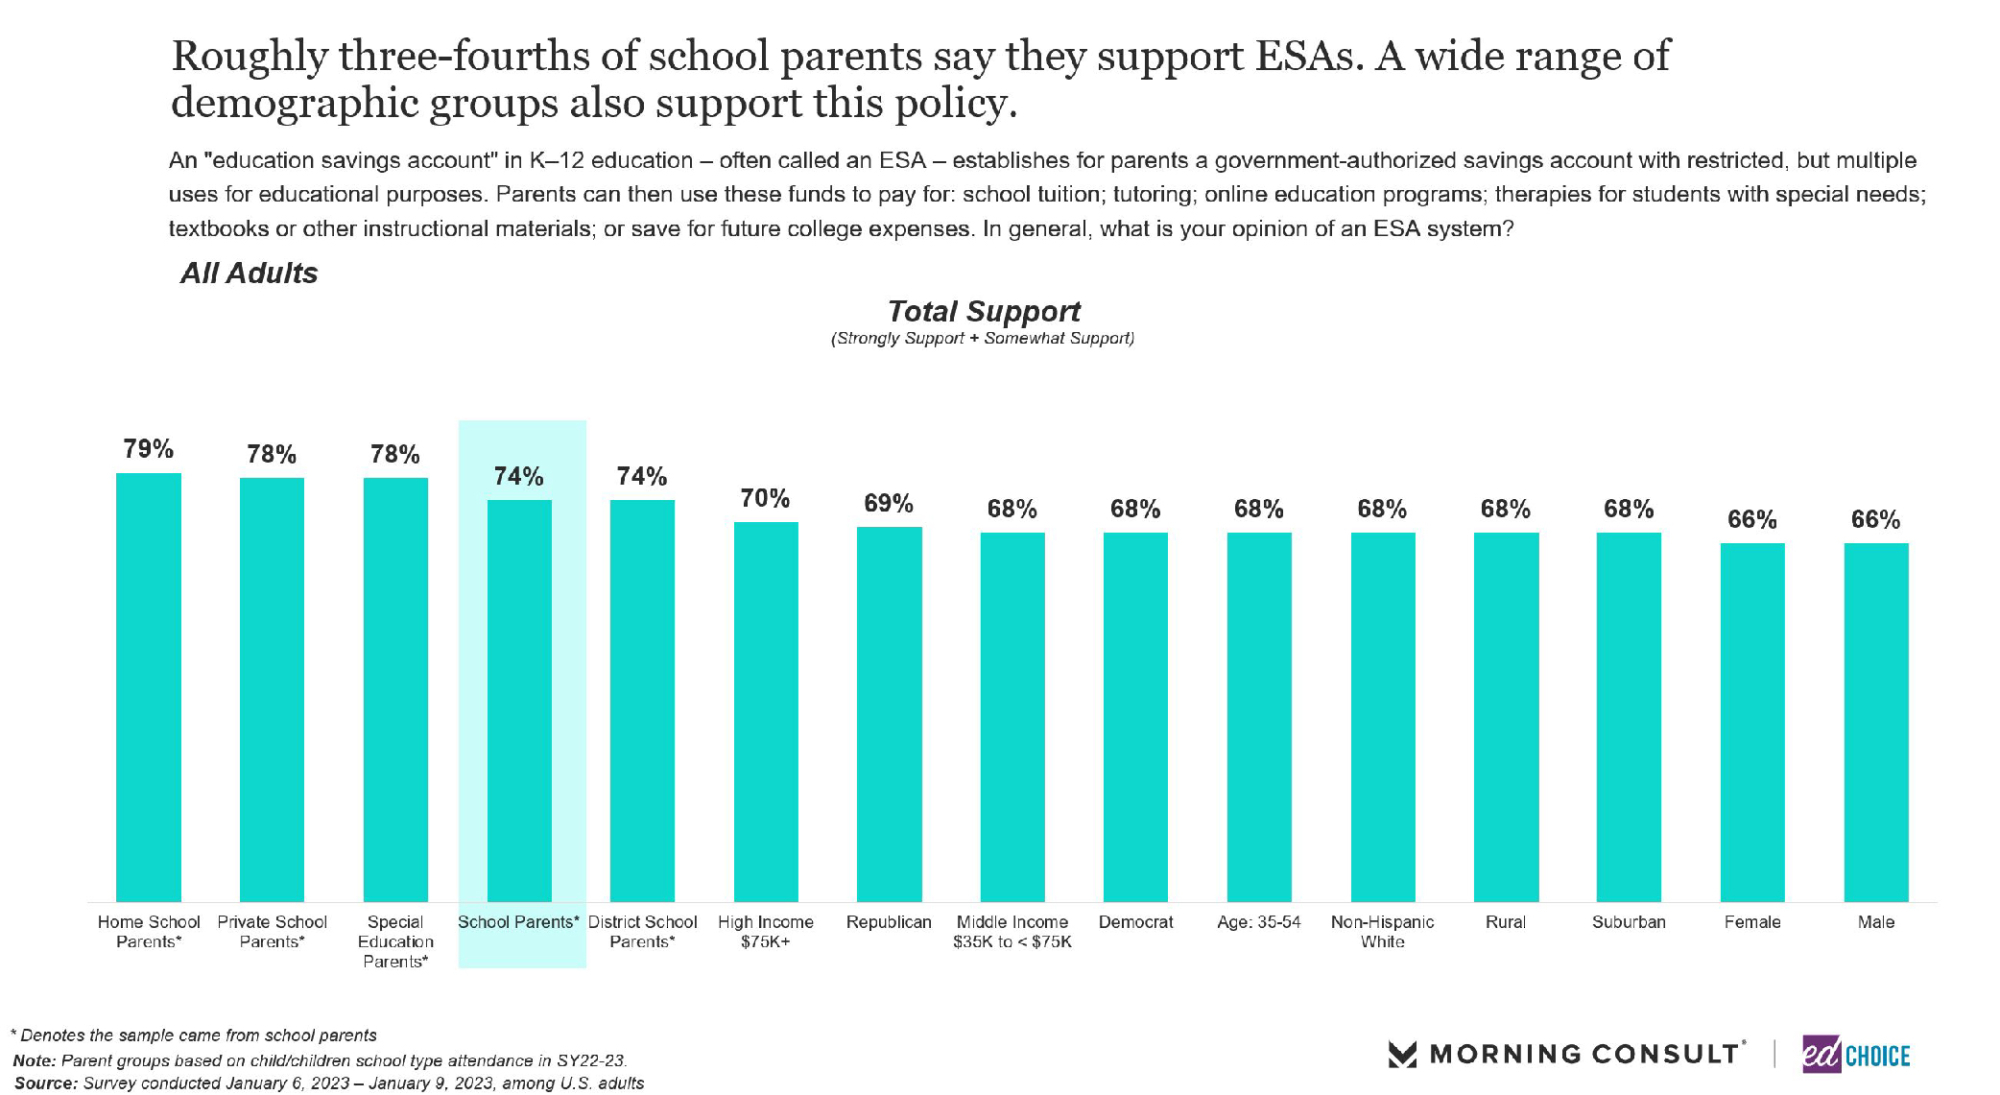
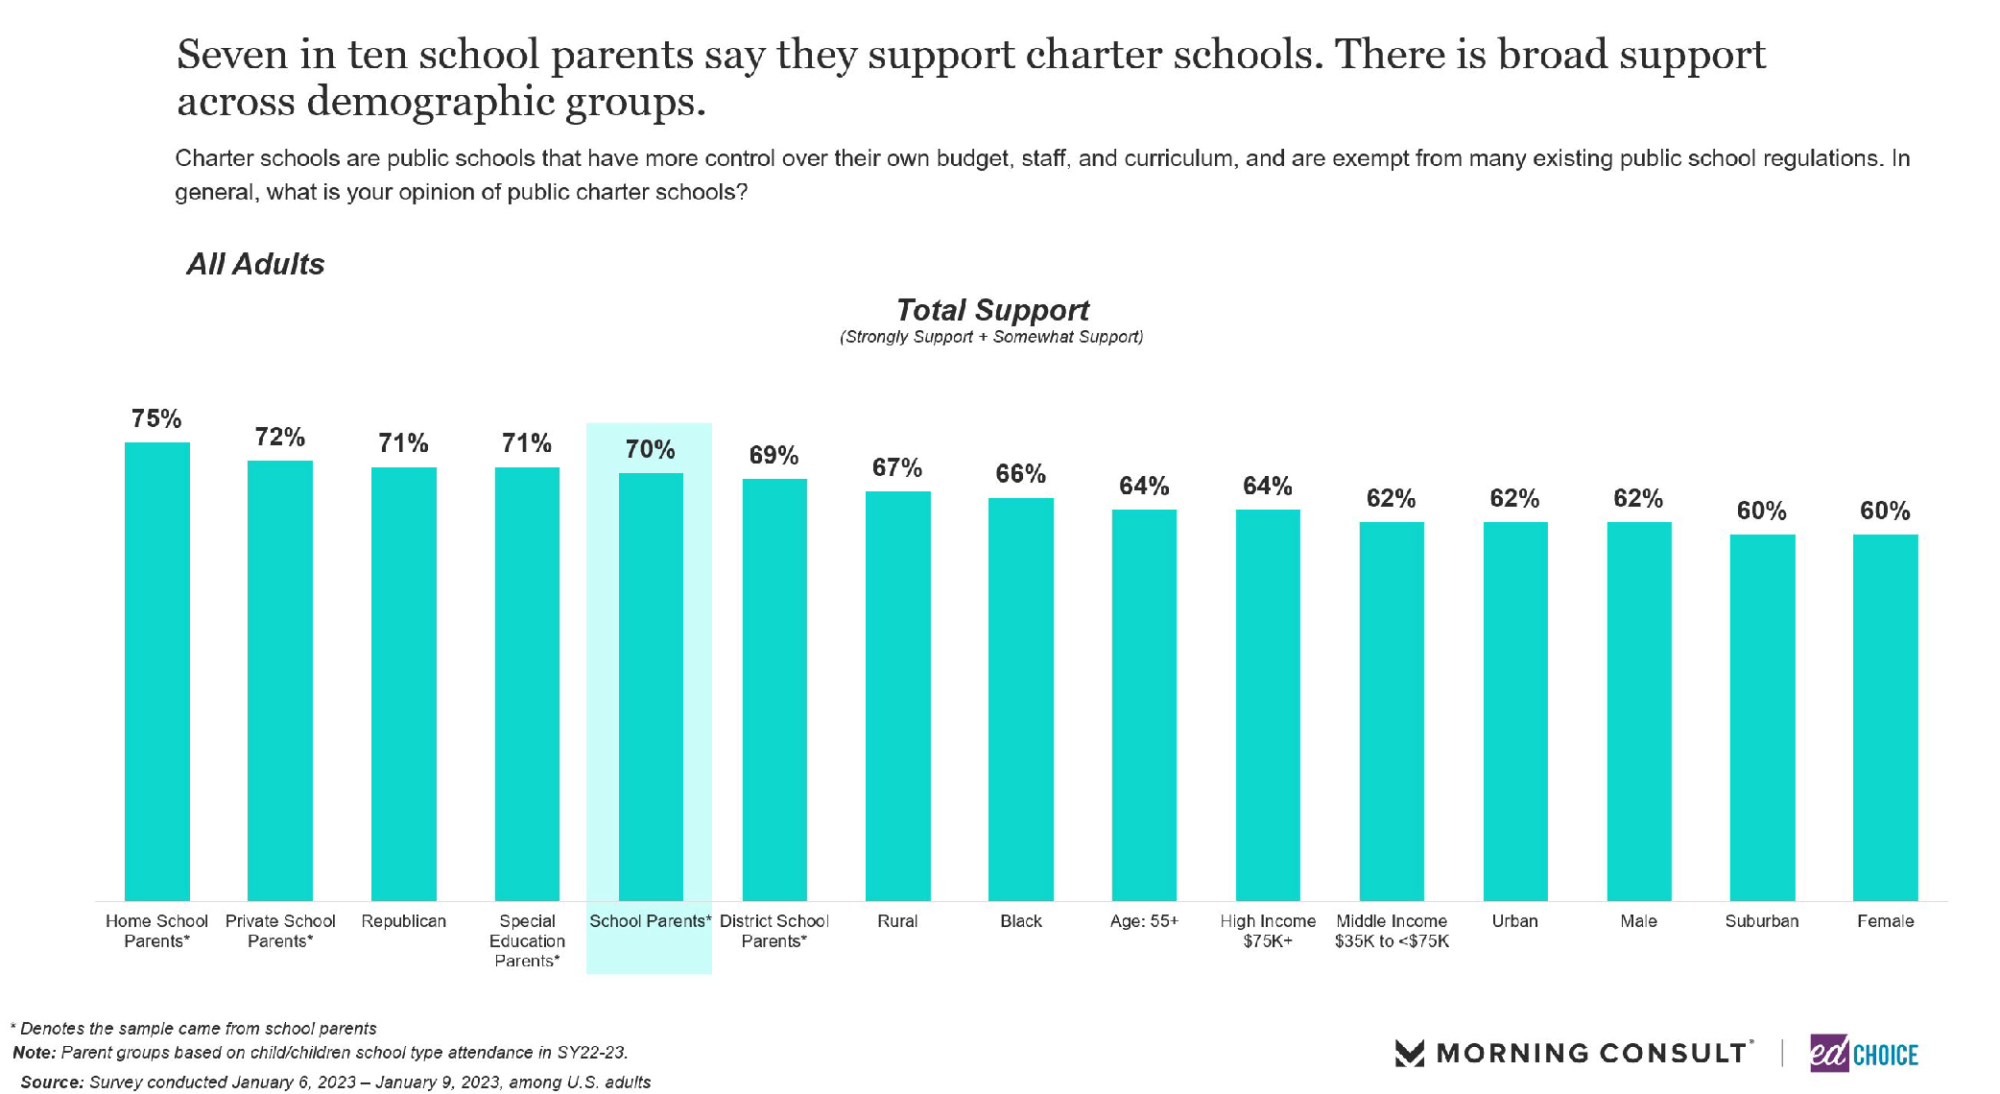
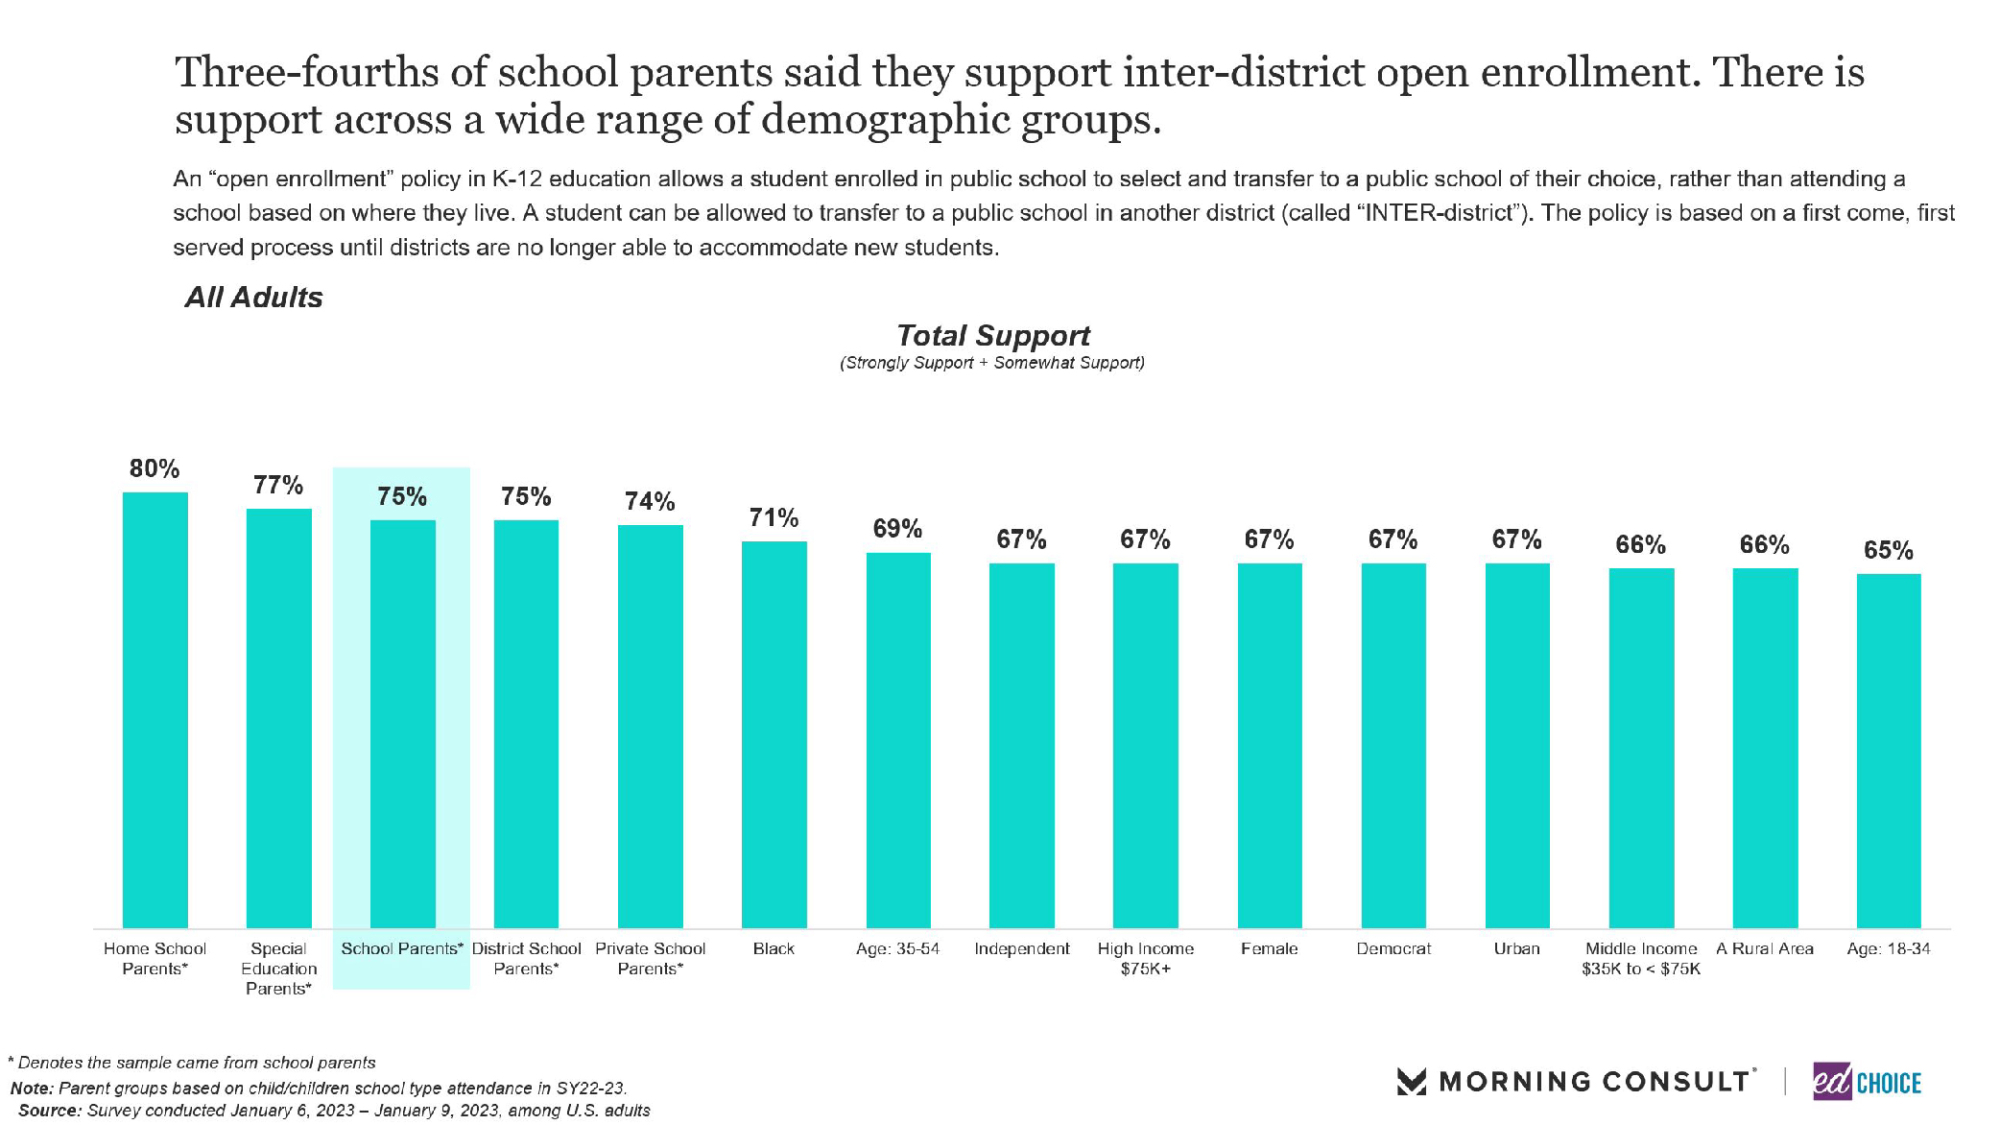
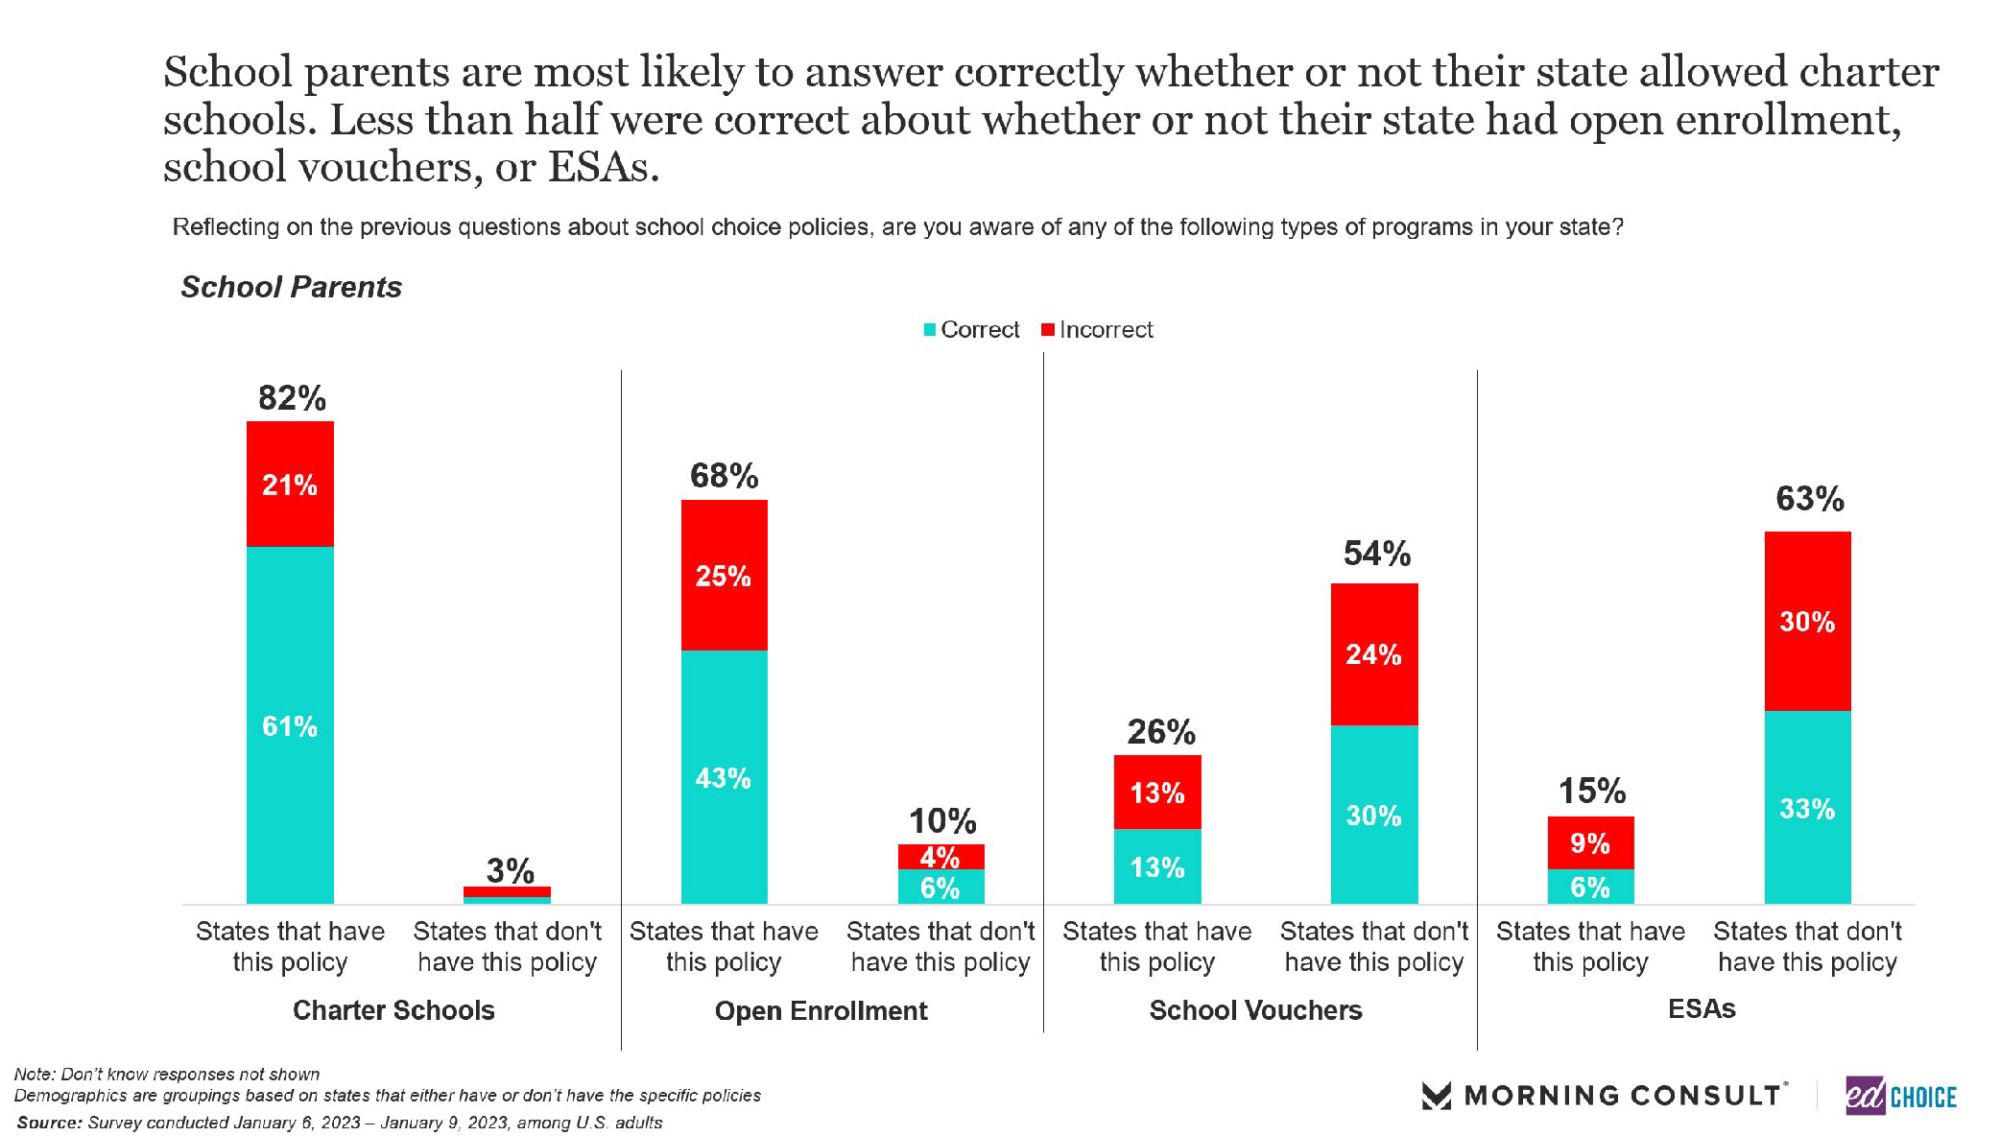
7. More than 70 percent of parents support school choice policies. Although support levels dipped slightly in January, parents support choice policies like education savings accounts (ESAs), vouchers, charter schools, and open enrollment at 74 percent, 71 percent, 70 percent, and 75 percent, respectively. The majority of Americans support school choice policies as well, albeit at a slightly lesser rate than parents. Recently we’ve asked parents about their awareness levels regarding school choice policies in their state. For charter schools and open enrollment, parents are more accurate than not when asked if such policies exist in their state. The same cannot be said for ESAs and vouchers, however. For states that have ESAs and vouchers available, the proportion of parents who are do not believe their state has such policies is equal or greater than the proportion of parents who are correct in saying their state has these policies.
Visit the EdChoice Public Opinion Tracker site to access past reports, crosstabs, and questionnaires. We update our national and state dashboards every month. We also provide a more in-depth description of our research and survey methods.
Our K–12 education polls archive is updated on a rolling basis, roughly a few times each month. Please don’t hesitate to let us know if we are missing any surveys, or if there are accidental errors.


