EdChoice Public Opinion Tracker: Top Takeaways April 2020
We released a lot of data when we launched the EdChoice Public Opinion Tracker yesterday. And we mean a lot. In this blog post, I share eight key takeaways based on our January-to-April polling waves. We will update this tracker with new results by the first Tuesday each month. Subscribe to our email list or follow us on social media to be notified of when those push online in early June. We’re excited to share our updates with you on this new journey.
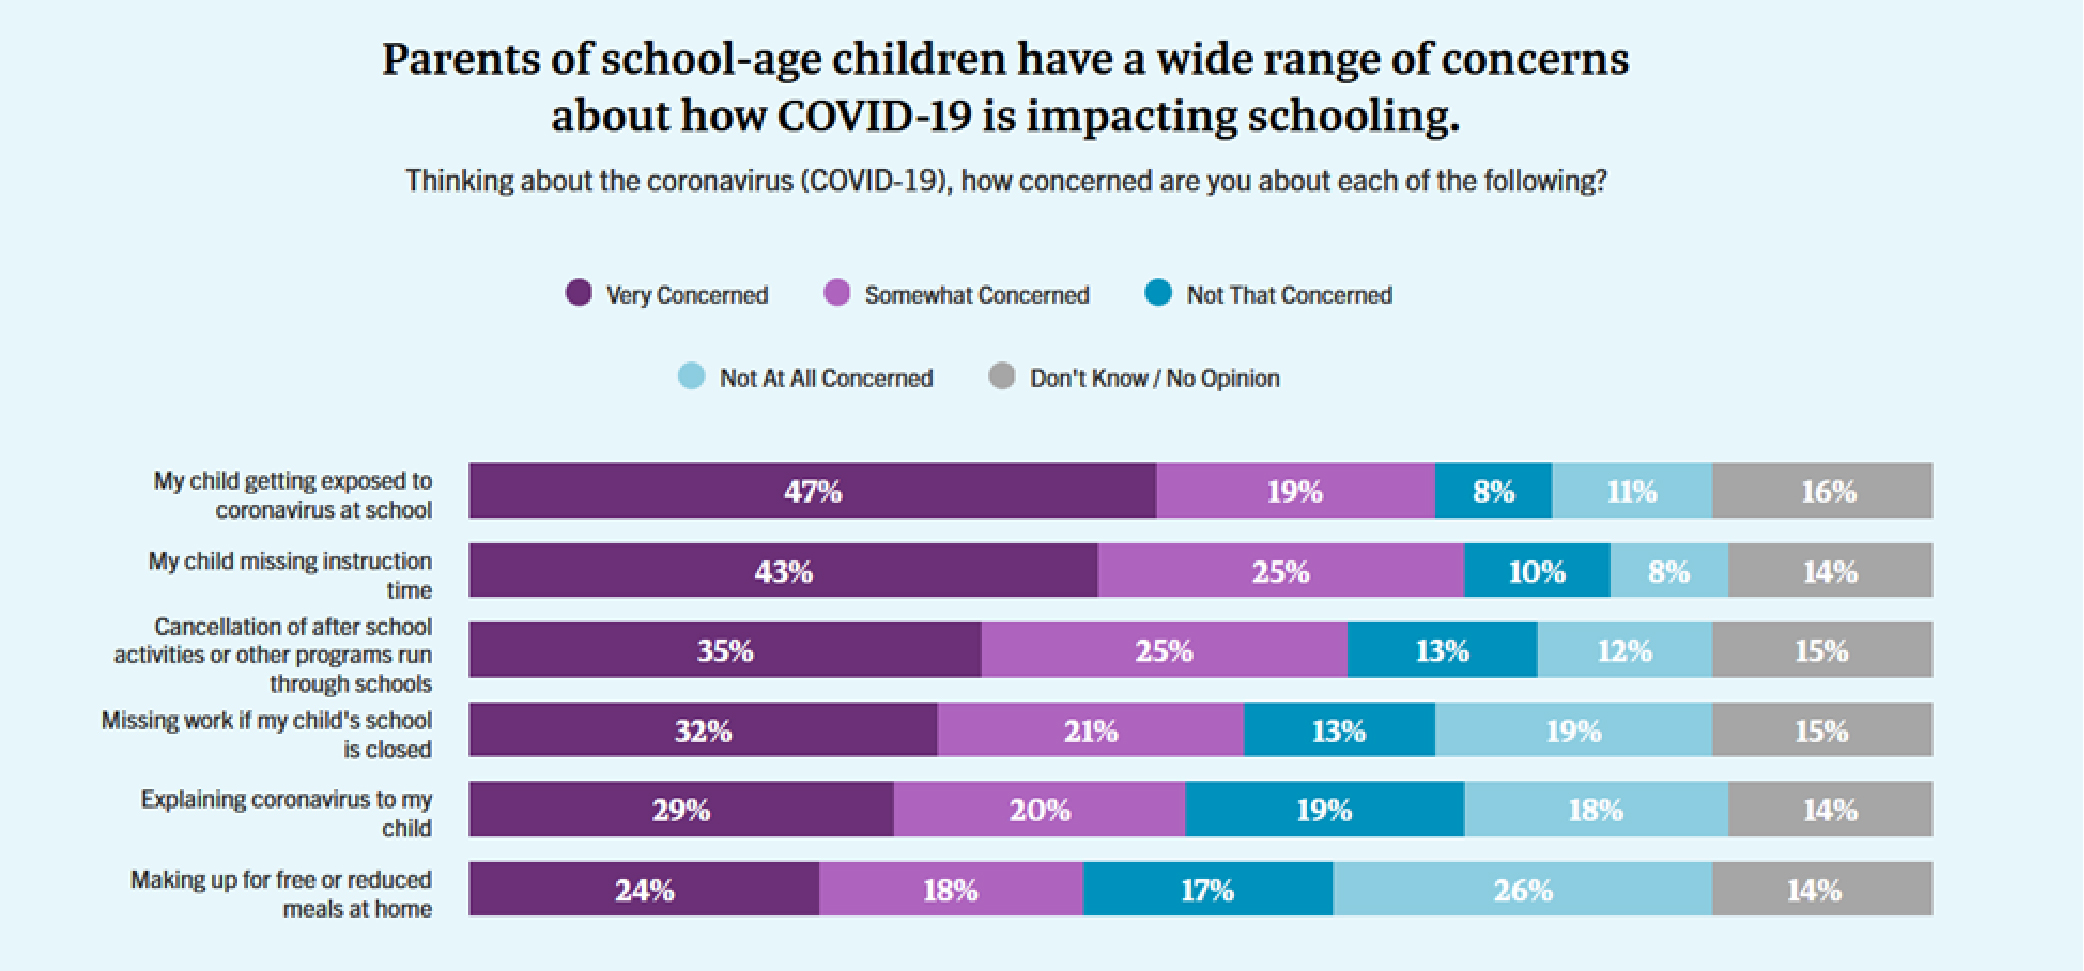
1. Not so fast. In the current COVID-19 pandemic, parents are clearly anxious about sending their kids back to school. This is a slightly bigger concern than even missed instruction or missed extracurricular activities. What does this mean for the fall and next school year? What plans will schools and local districts have in place to meet those concerns?
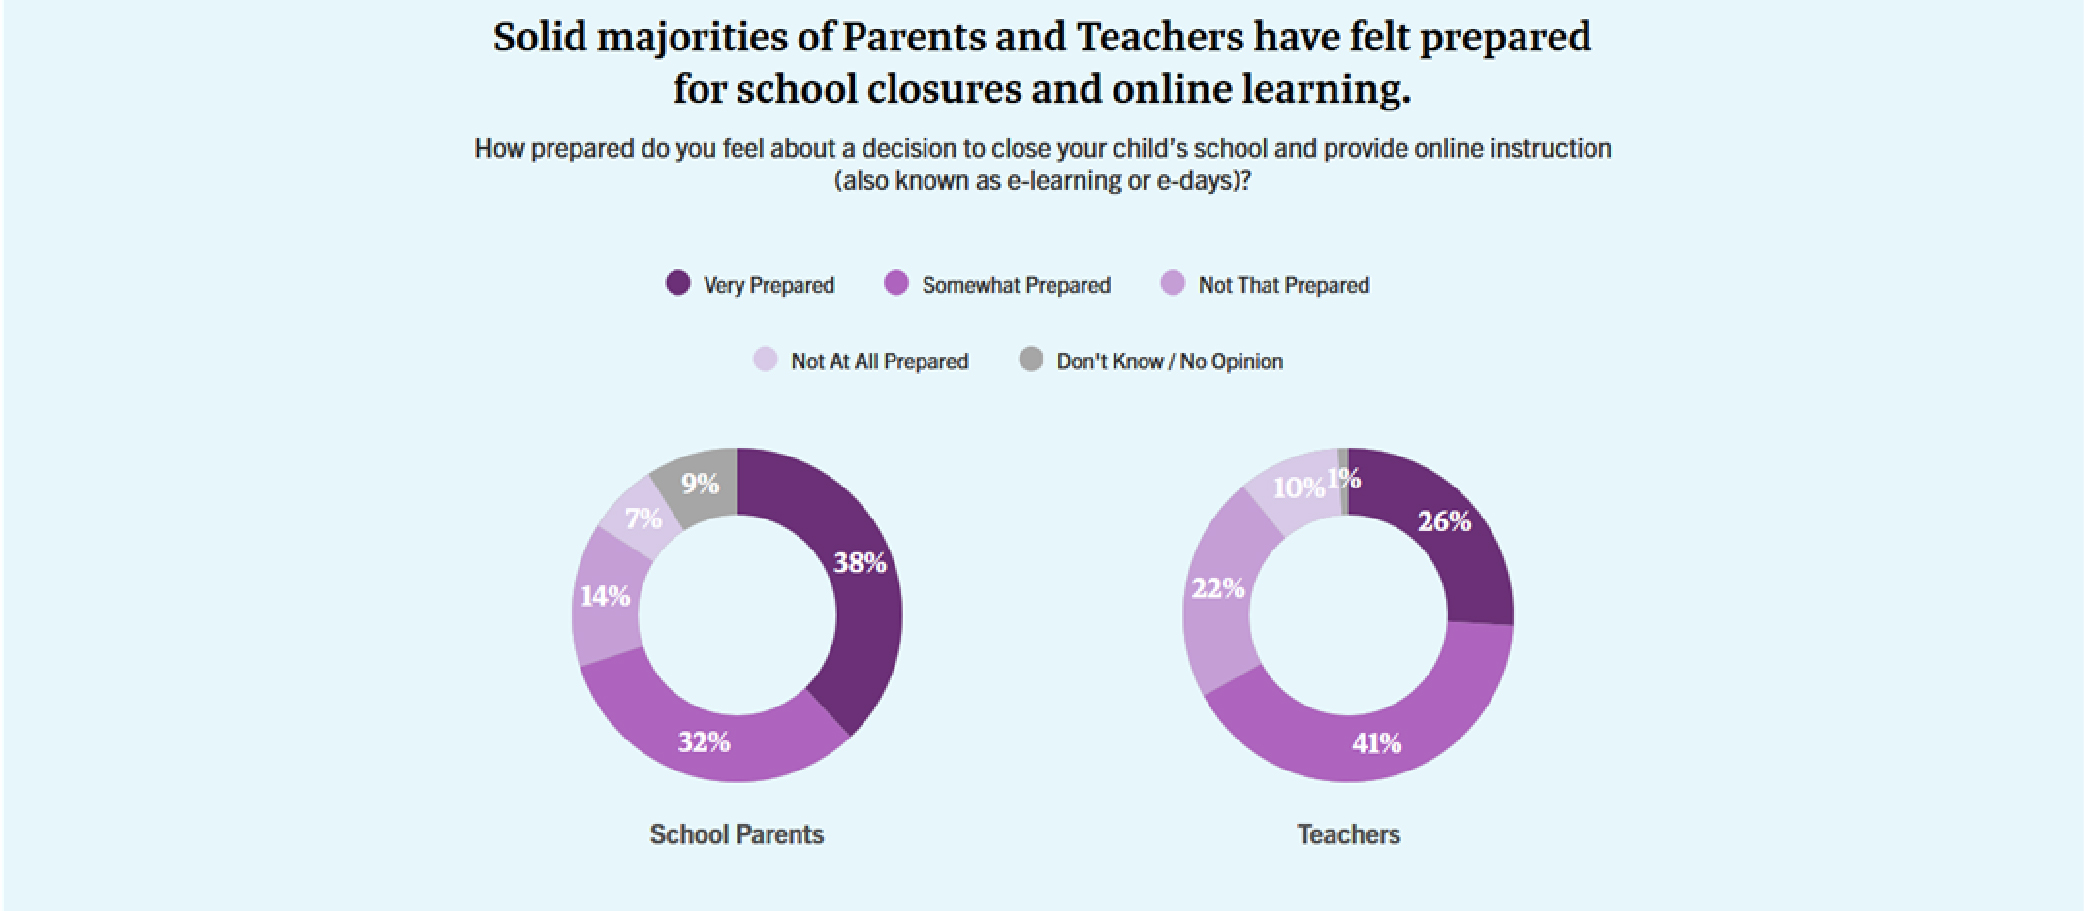
2. This is new to me. A solid majority of parents say they have felt at least somewhat prepared for the transition to e-learning and distance learning. My wife and I perhaps felt “not that prepared” as our local schools transitioned on a dime to distance learning for our two young daughters. Our school district had piloted “e-days” for a few years, but the days are never easy for us by any stretch of the imagination, and I think this sentiment has been shared among friends and neighbors. It will be interesting to see if the nearly 40 percent of school parents who said they felt “very prepared” dips at all in the next two months.
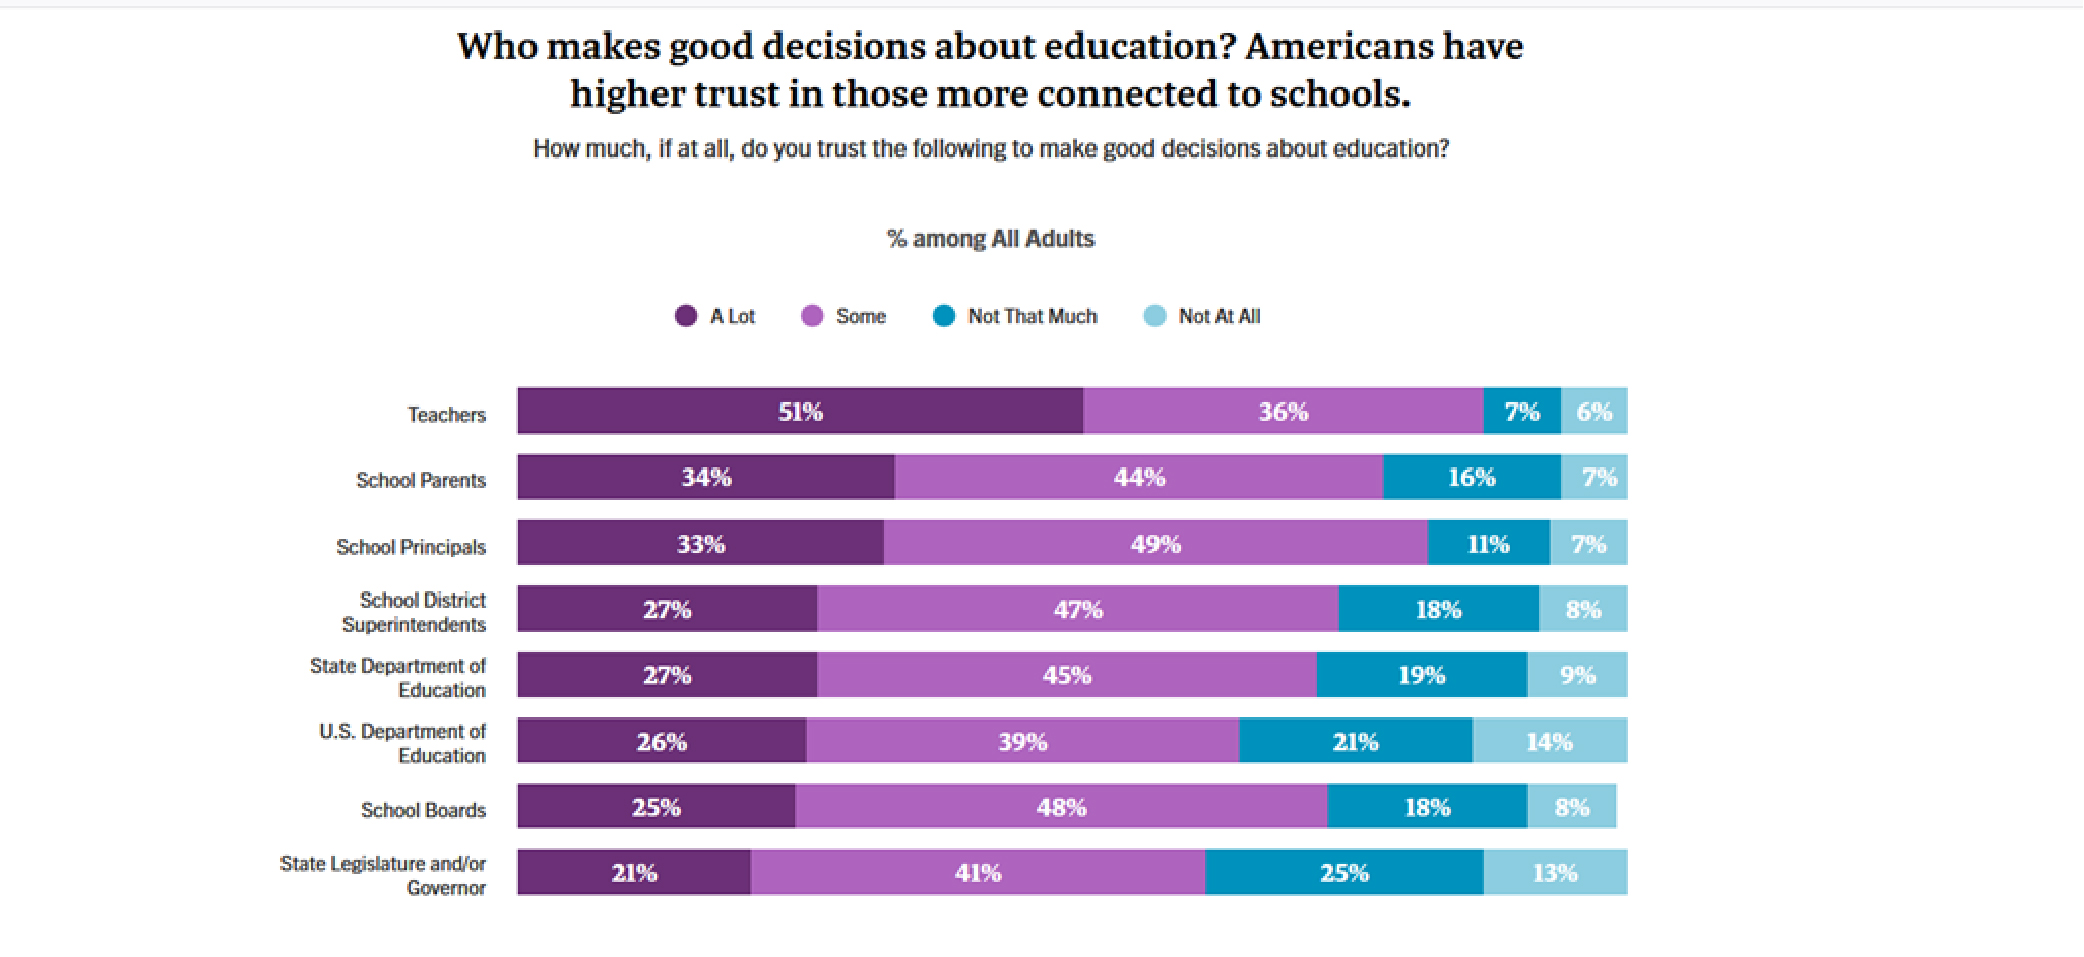
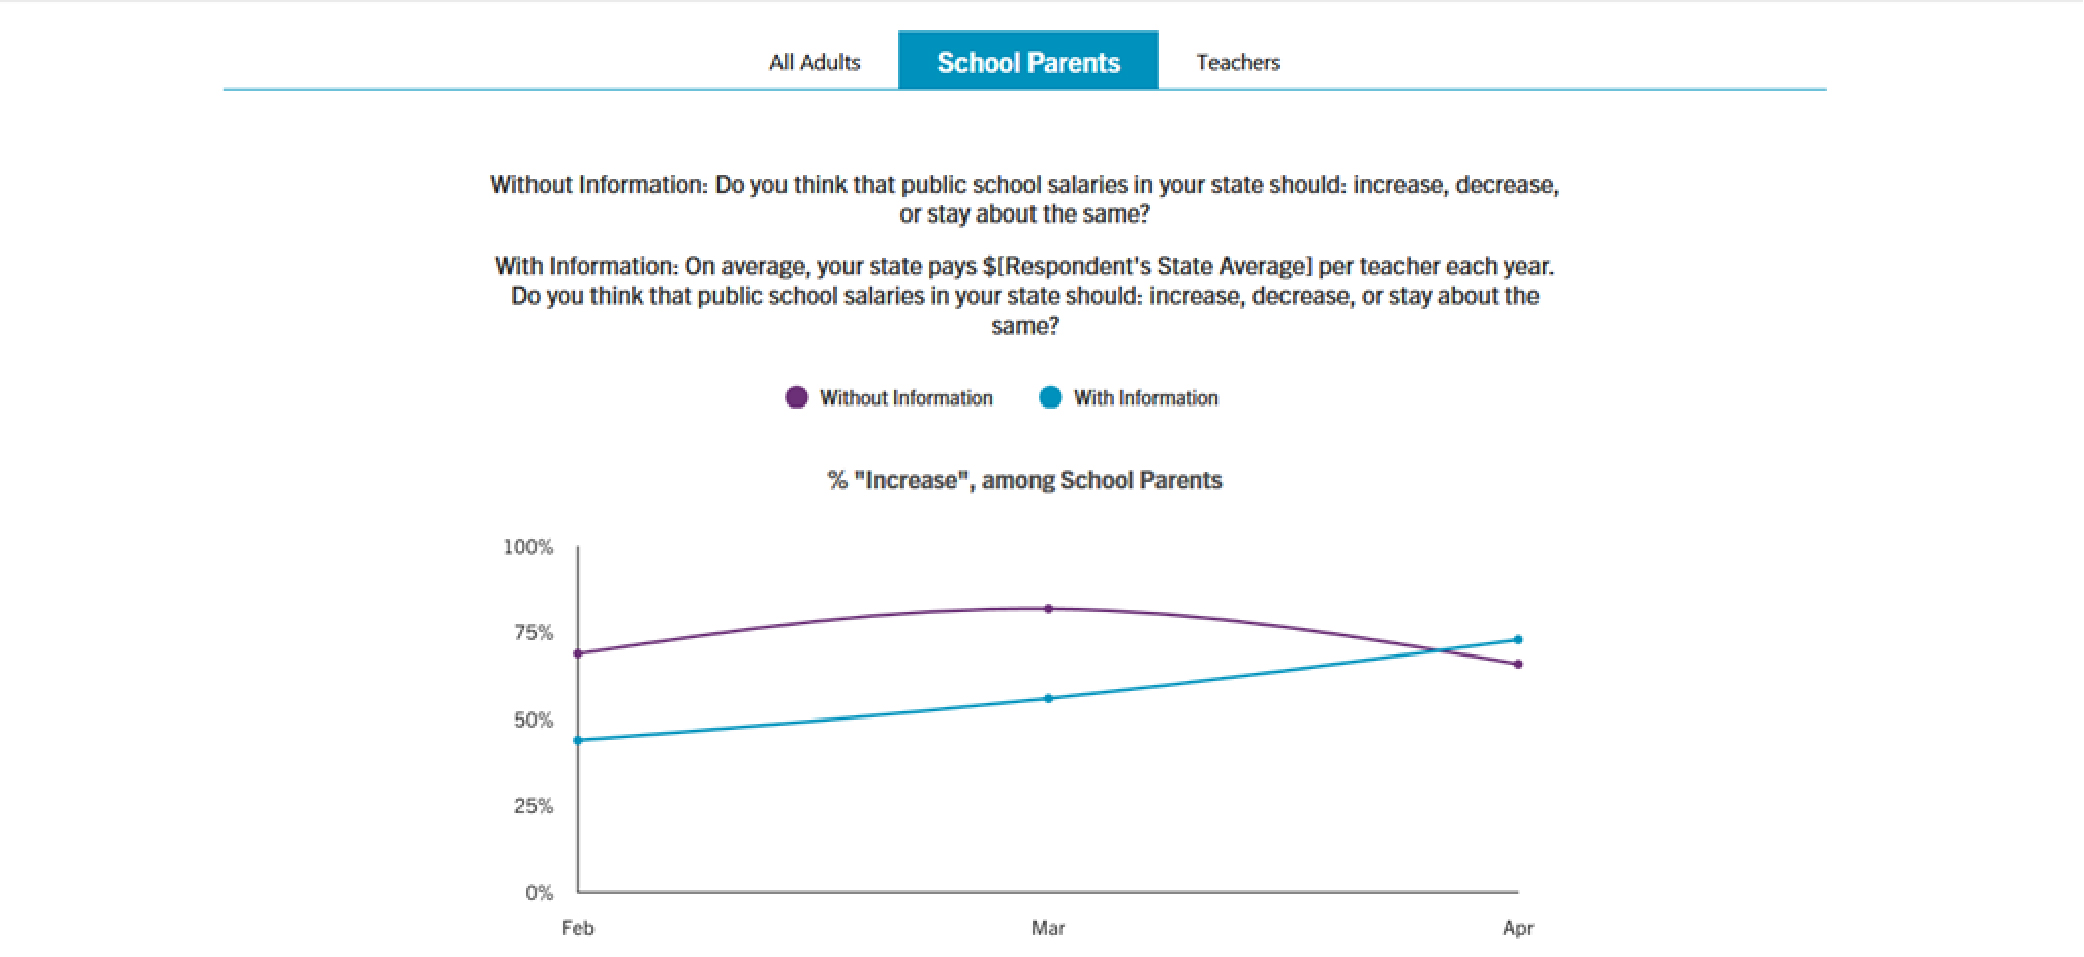
3. It’s Teacher Appreciation Week, and current poll results should definitely hearten America’s educators. The general public and school parents say they are most trustworthy, compared to other stakeholders in K–12 education. We also have asked an experimental question regarding teacher pay. Over the course of a few months, it appears the public is more willing to say teachers should be paid more. That is true even when respondents were told their state’s average teacher salary via and “informed” version of this question where salary data is given to them. There has been a jump of more than 20 points in affirmative responses to this question! Perhaps parents and the general public are now realizing – while quarantined and seeing media coverage—how challenging it can be to facilitate instruction and learning for children.
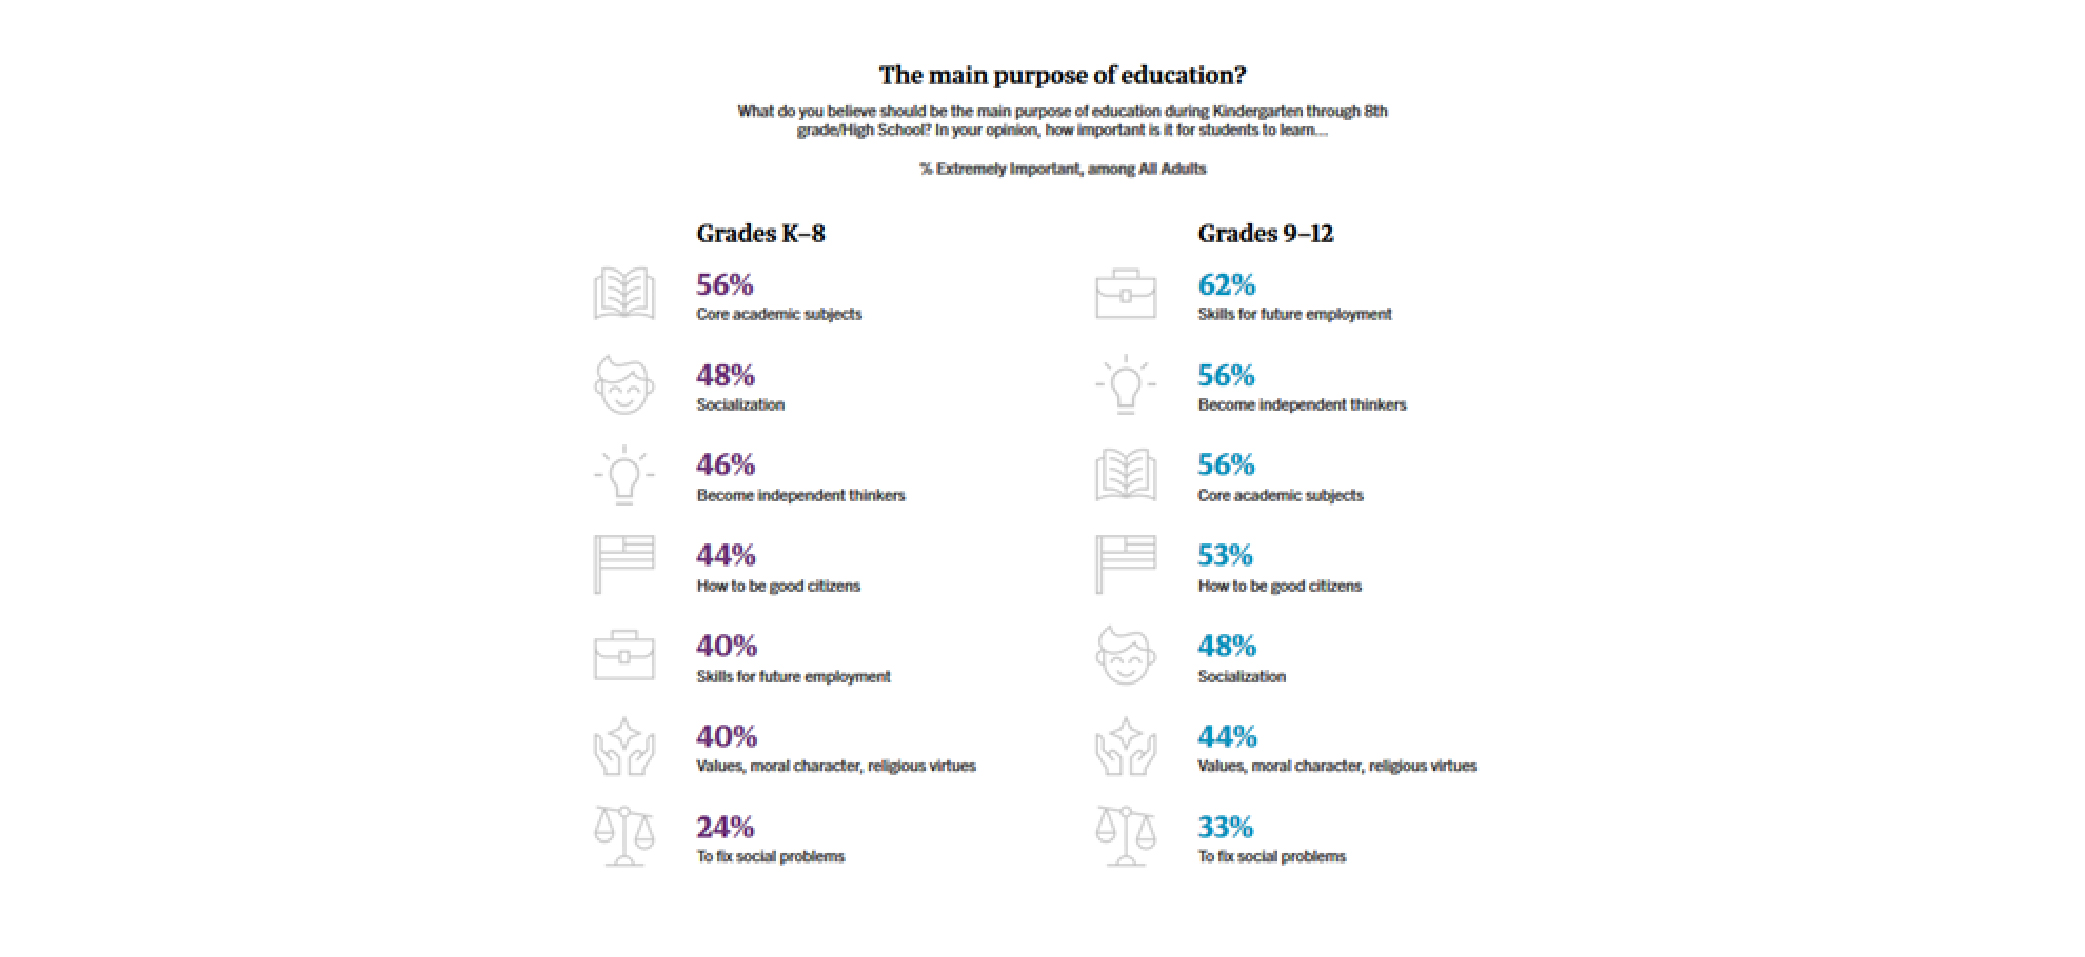
4. When we are talking about policy decisions, we should stop lumping all students together in K–12. The public has higher expectations for high school grades than elementary grades. For younger students, the public values learning core academic subjects above other things. For high school students, there is more clustering at the top, but it appears learning skills for future employment is considered the most important purpose for high school.
Now, to the more familiar questions from our annual Schooling in America survey.
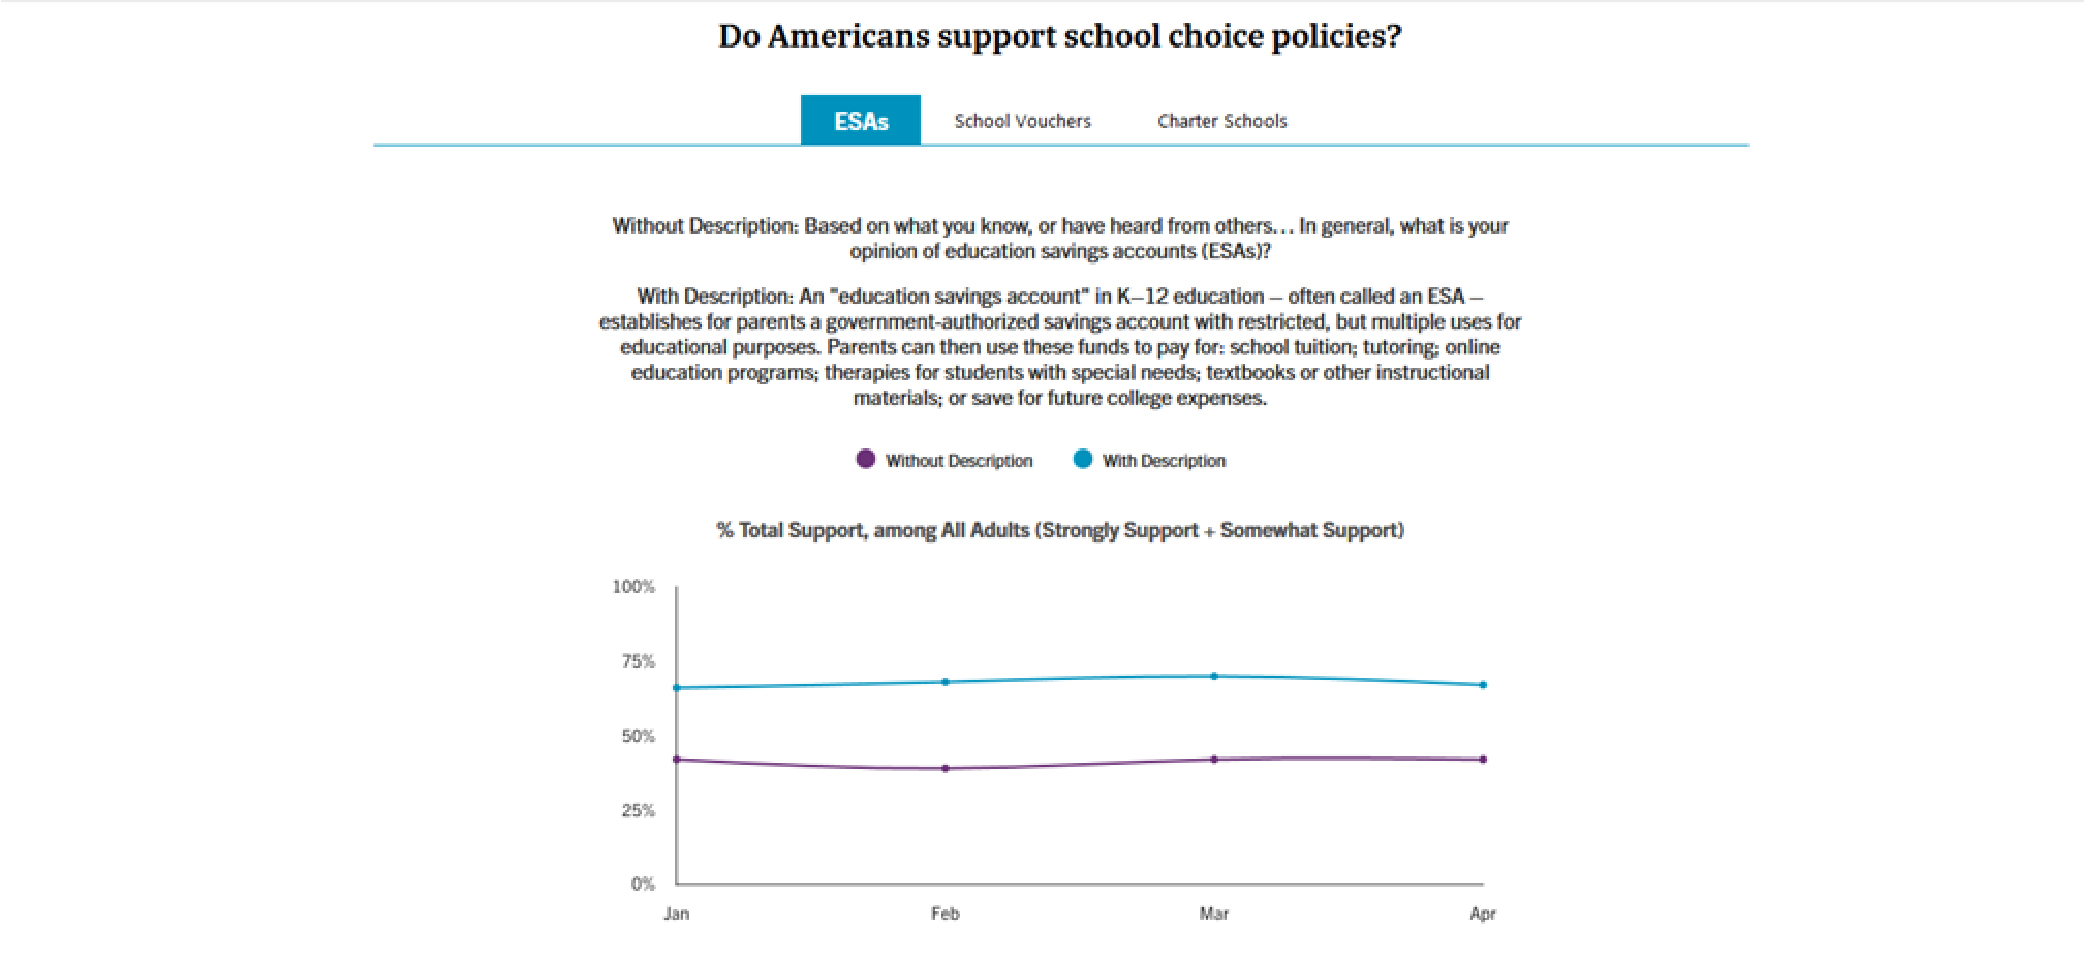
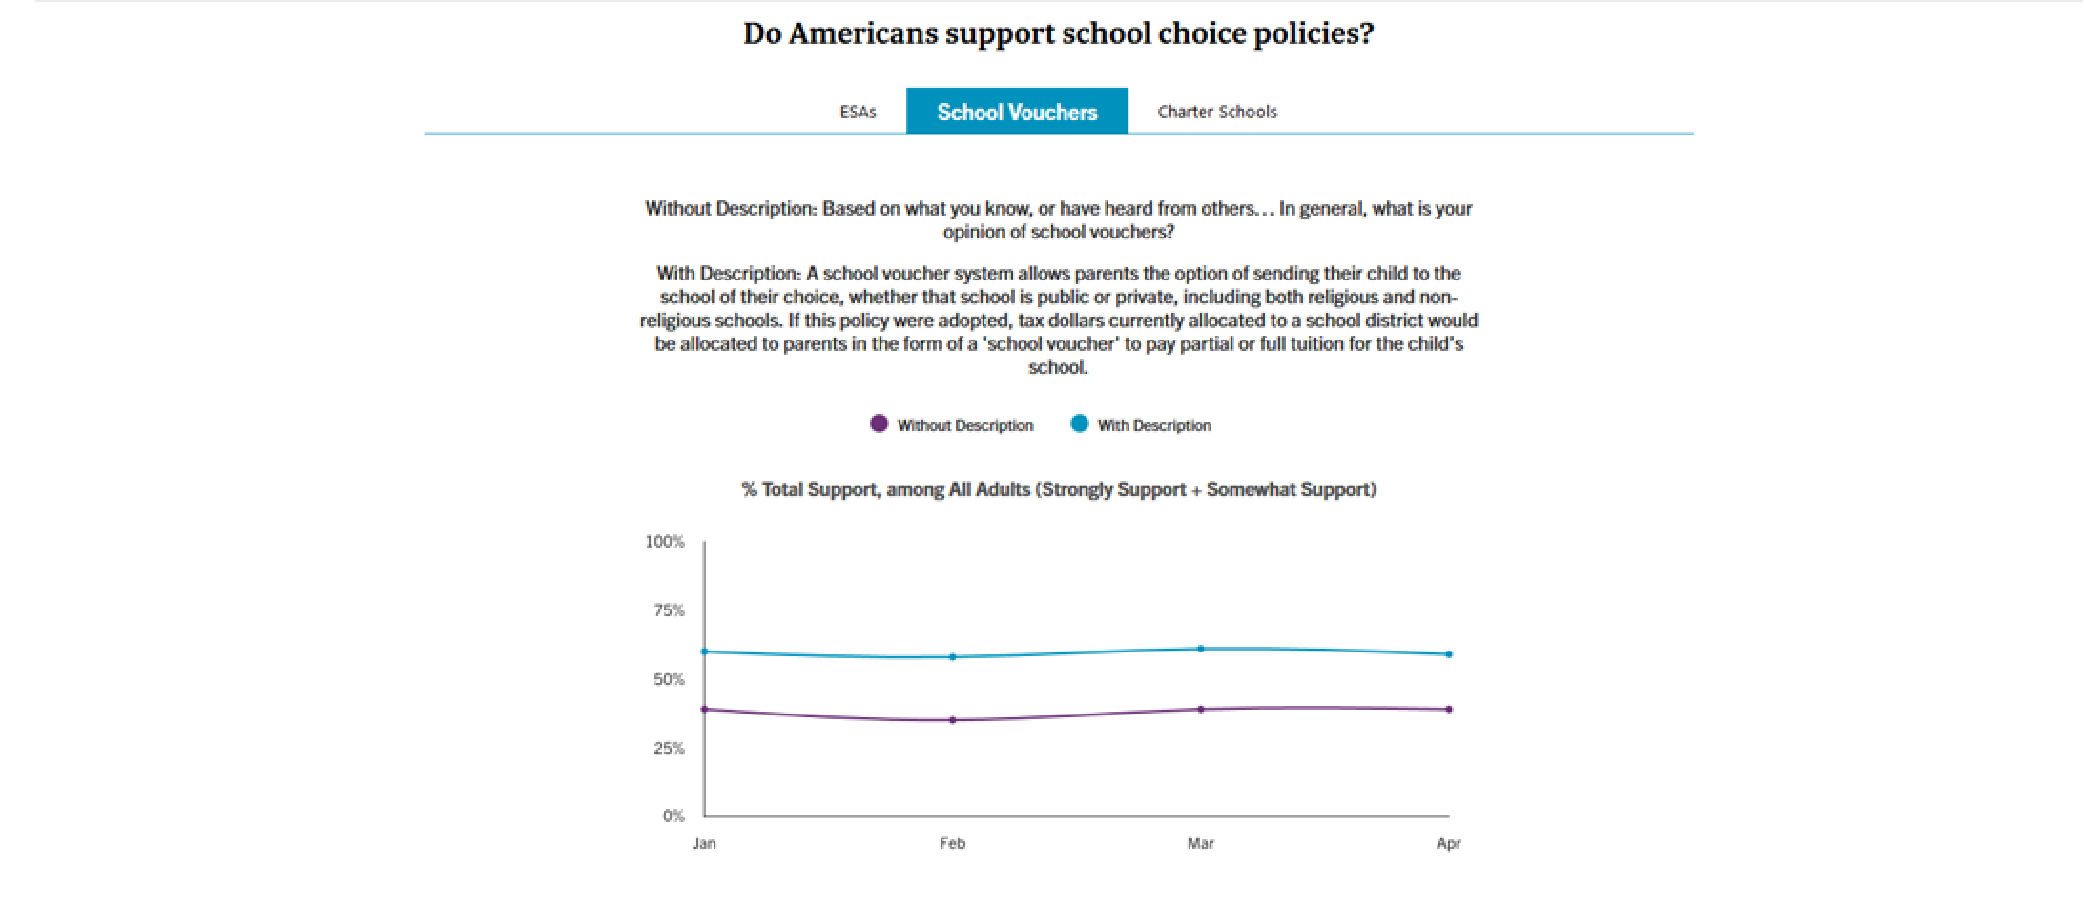
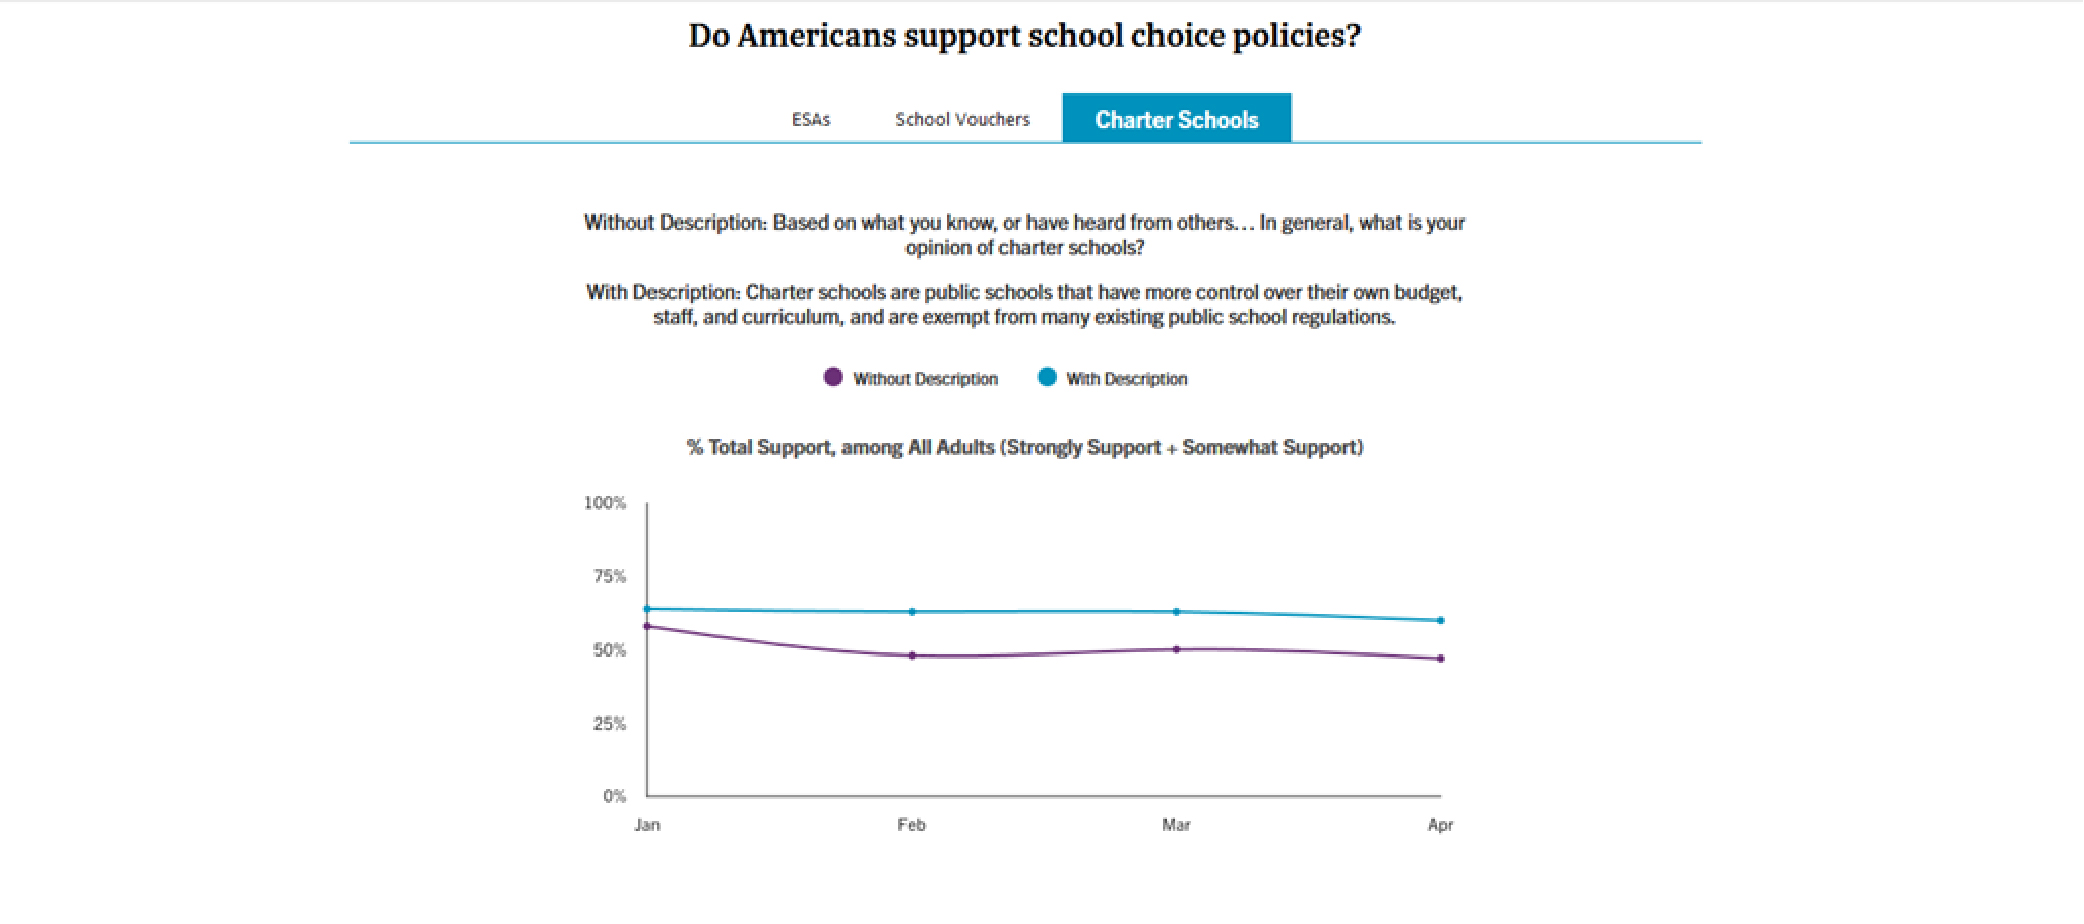
5. On questions about education savings accounts (ESA), school vouchers and charter schools, the general public supports these school choice reforms and policies. Pluralities of support exist (high 30s to high 40s) when respondents are not given any kind of description—based on what they already know, hear or perceive. Once given a proper description of these policies, we generally see support in the high 50s (vouchers, charters) to high 60s (ESAs).
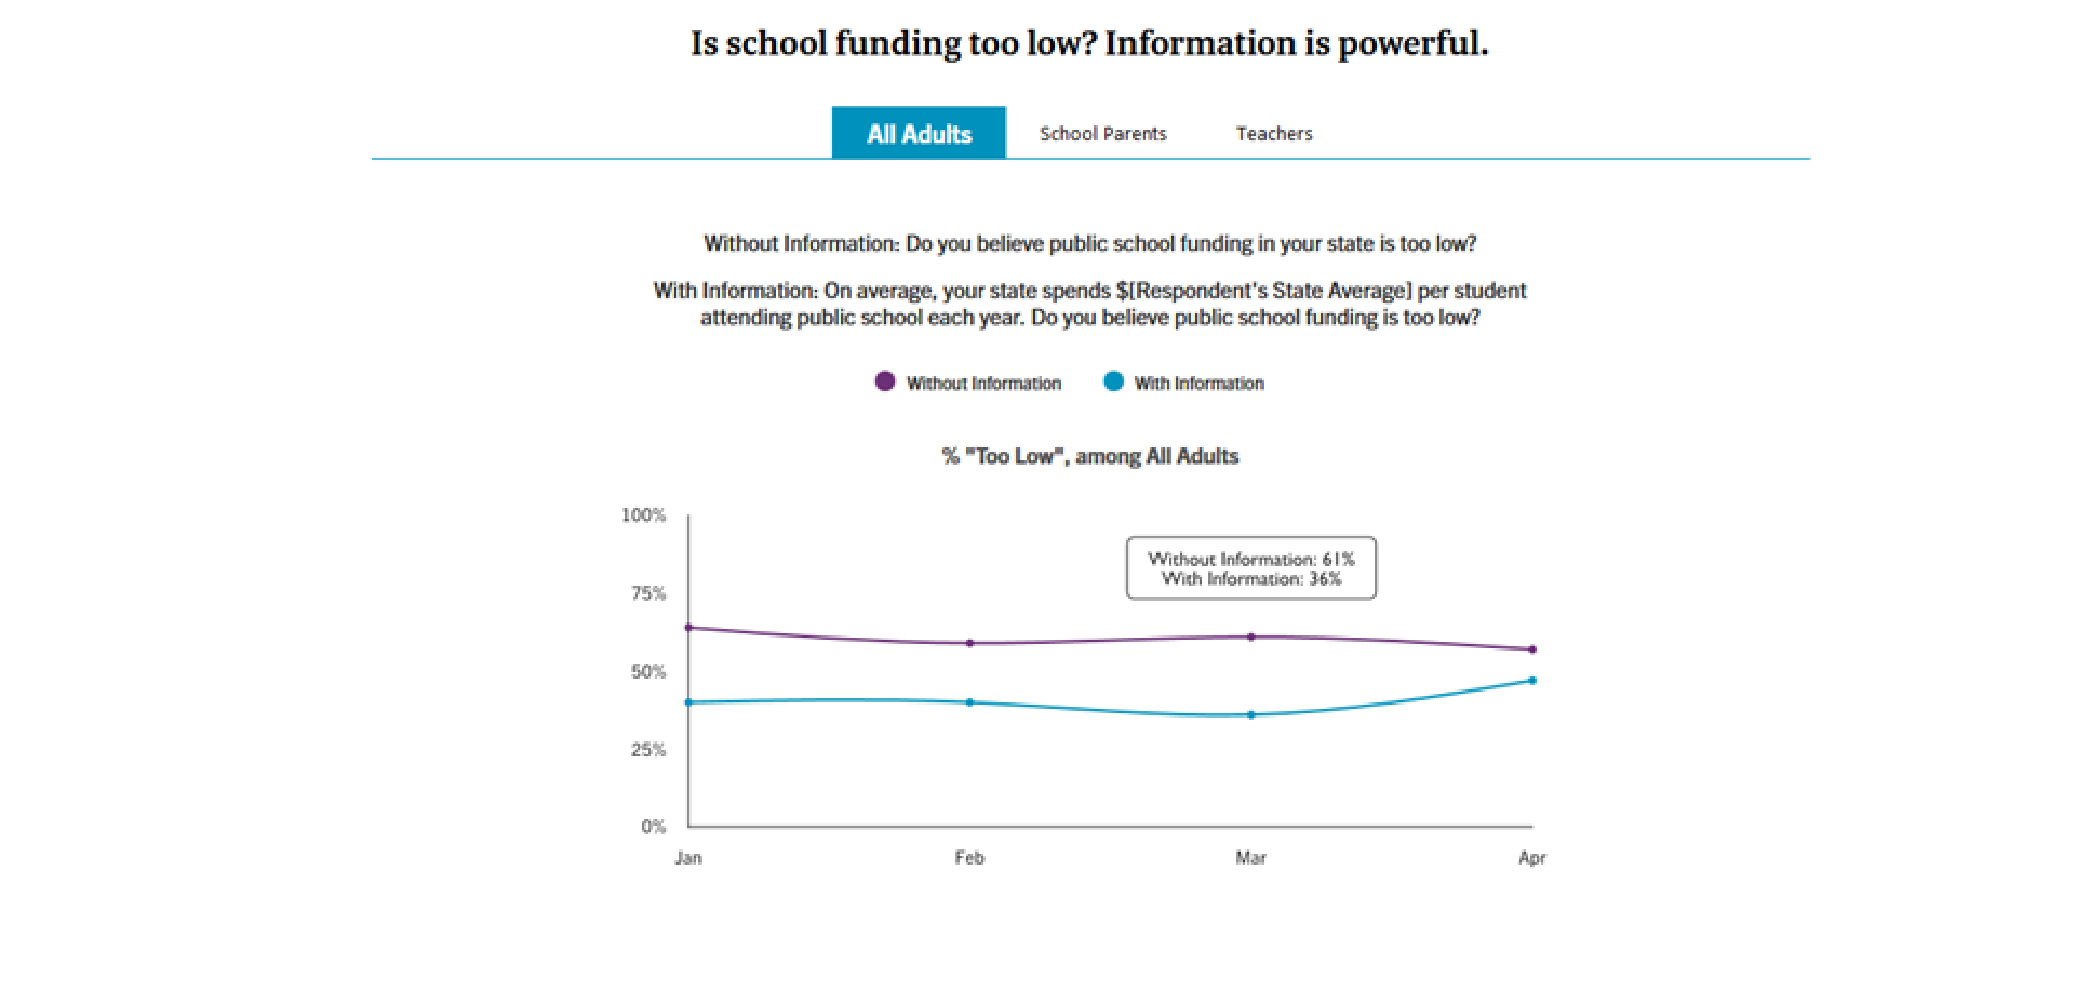
6. We continue to see how information about per-student spending affects attitudes on funding. It is another experimental question. Half the sample is given a question about whether they think school funding is too low, too high or about right. The other half-sample is given the same question, but we insert a sentence at the beginning which gives the respondent her/his state’s actual per-student spending average, based on the most recent federal data. We see the proportion of “too low” responses drop 20-25 percentage points when people get the real numbers. We have observed this similar result to varying degree for nearly a decade.
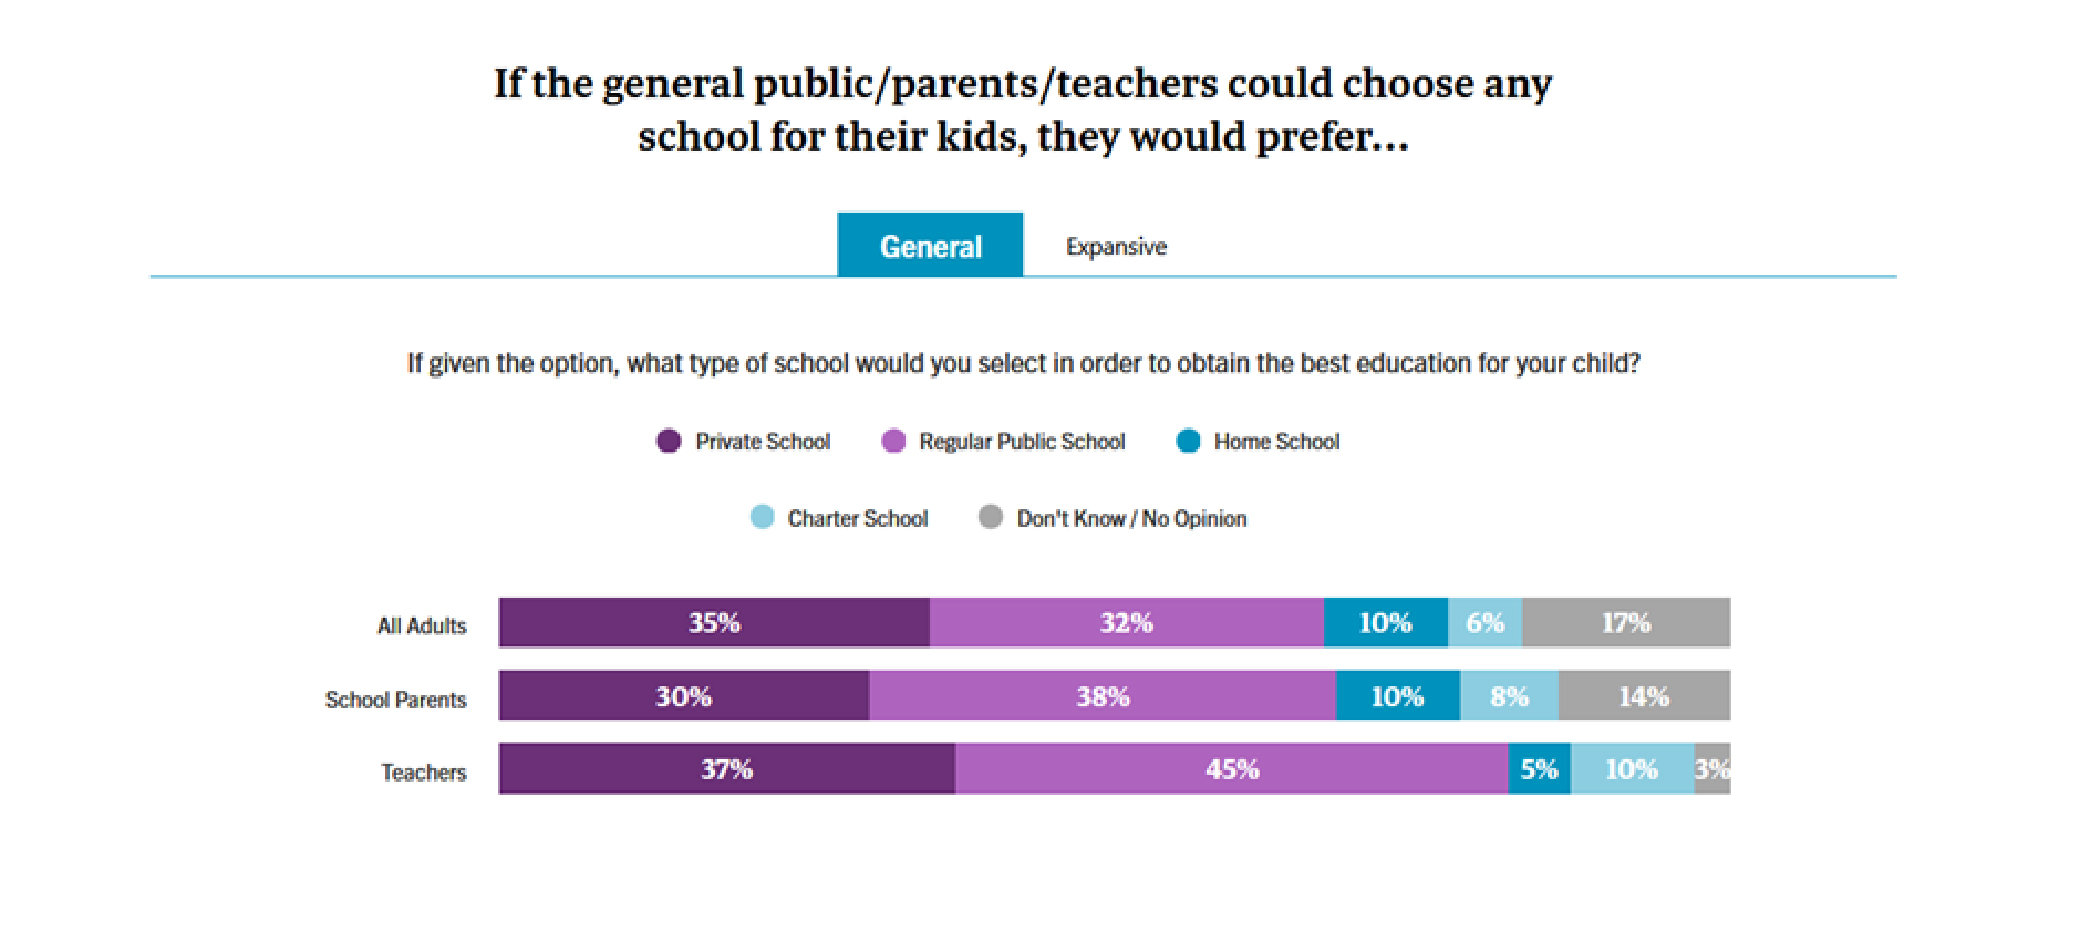
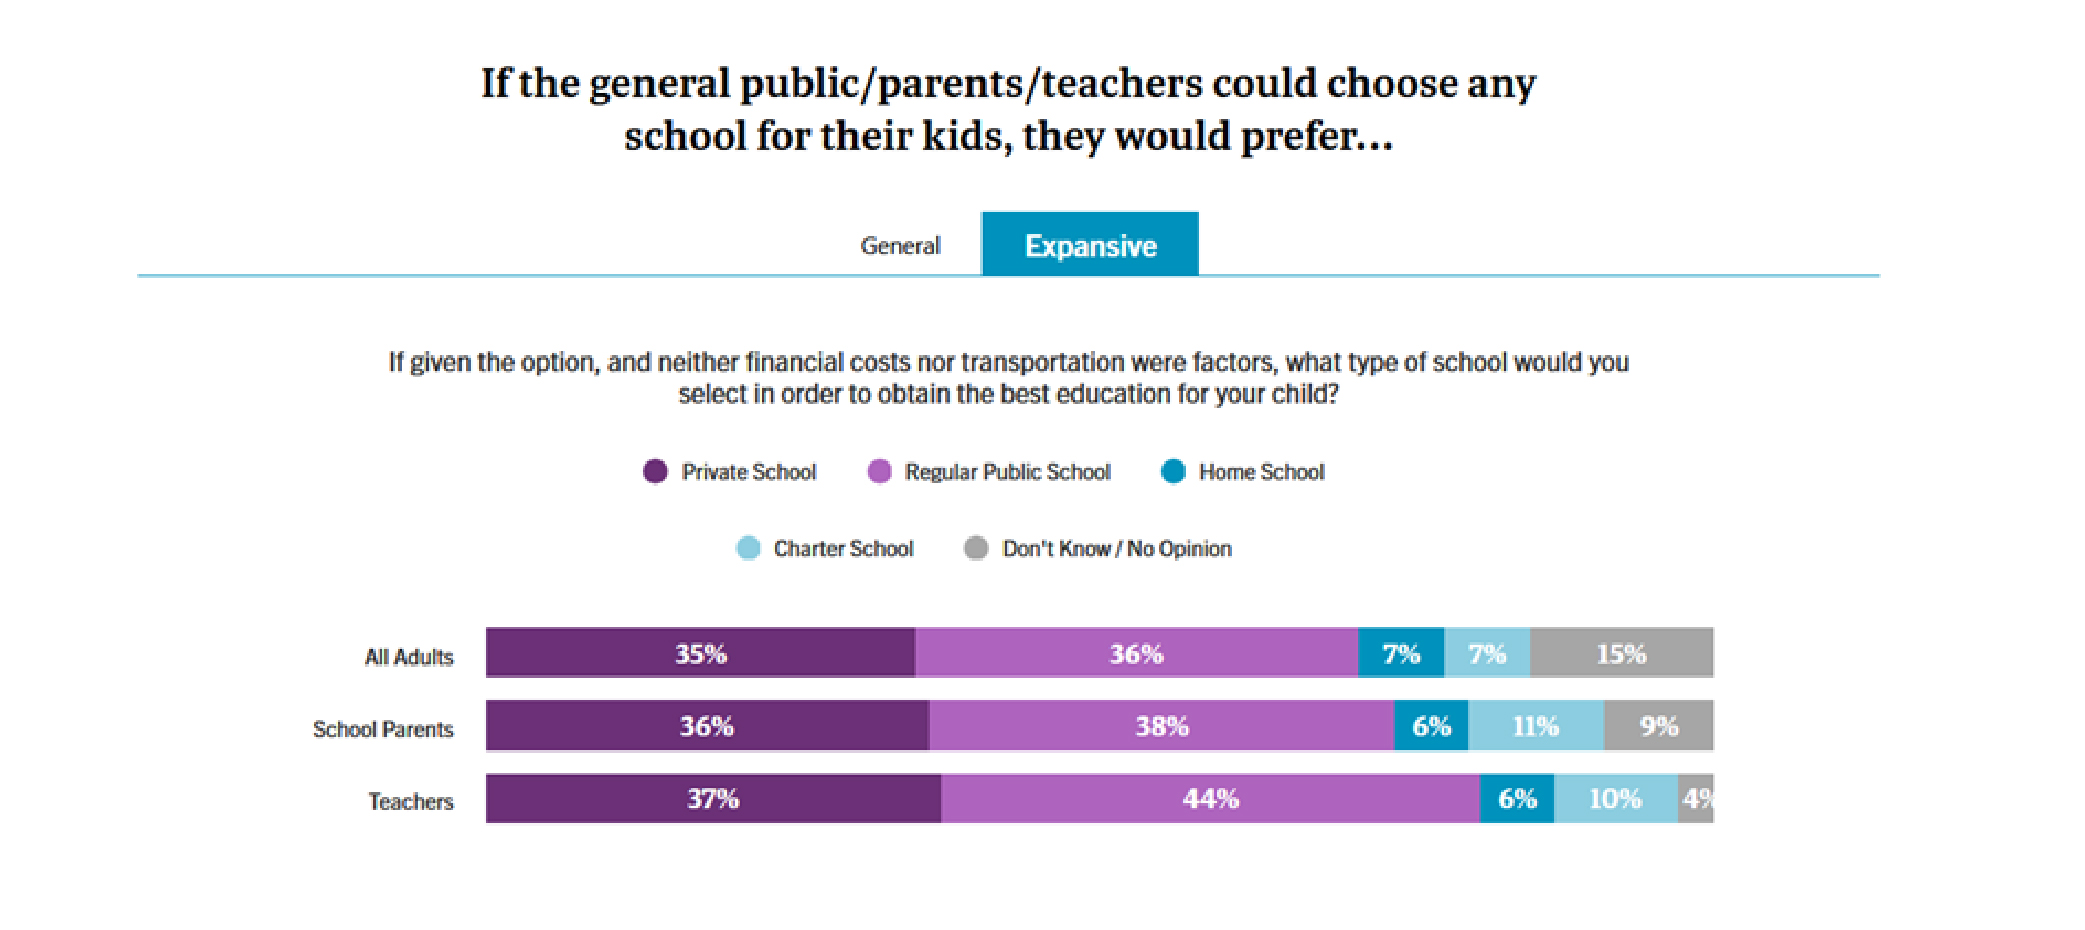
7. We also ask parents where they prefer to send their children to school. Public schools come in first, and private schools come in second, but those proportions tend to converge when question wording states excludes finances and transportation as factors. It should also be noted that the proportions we see are wildly different than the real-world enrollment patterns in America, where about 80 percent of K–12 students attend public district schools. Half that percentage in our survey say district schools are their most preferred option.
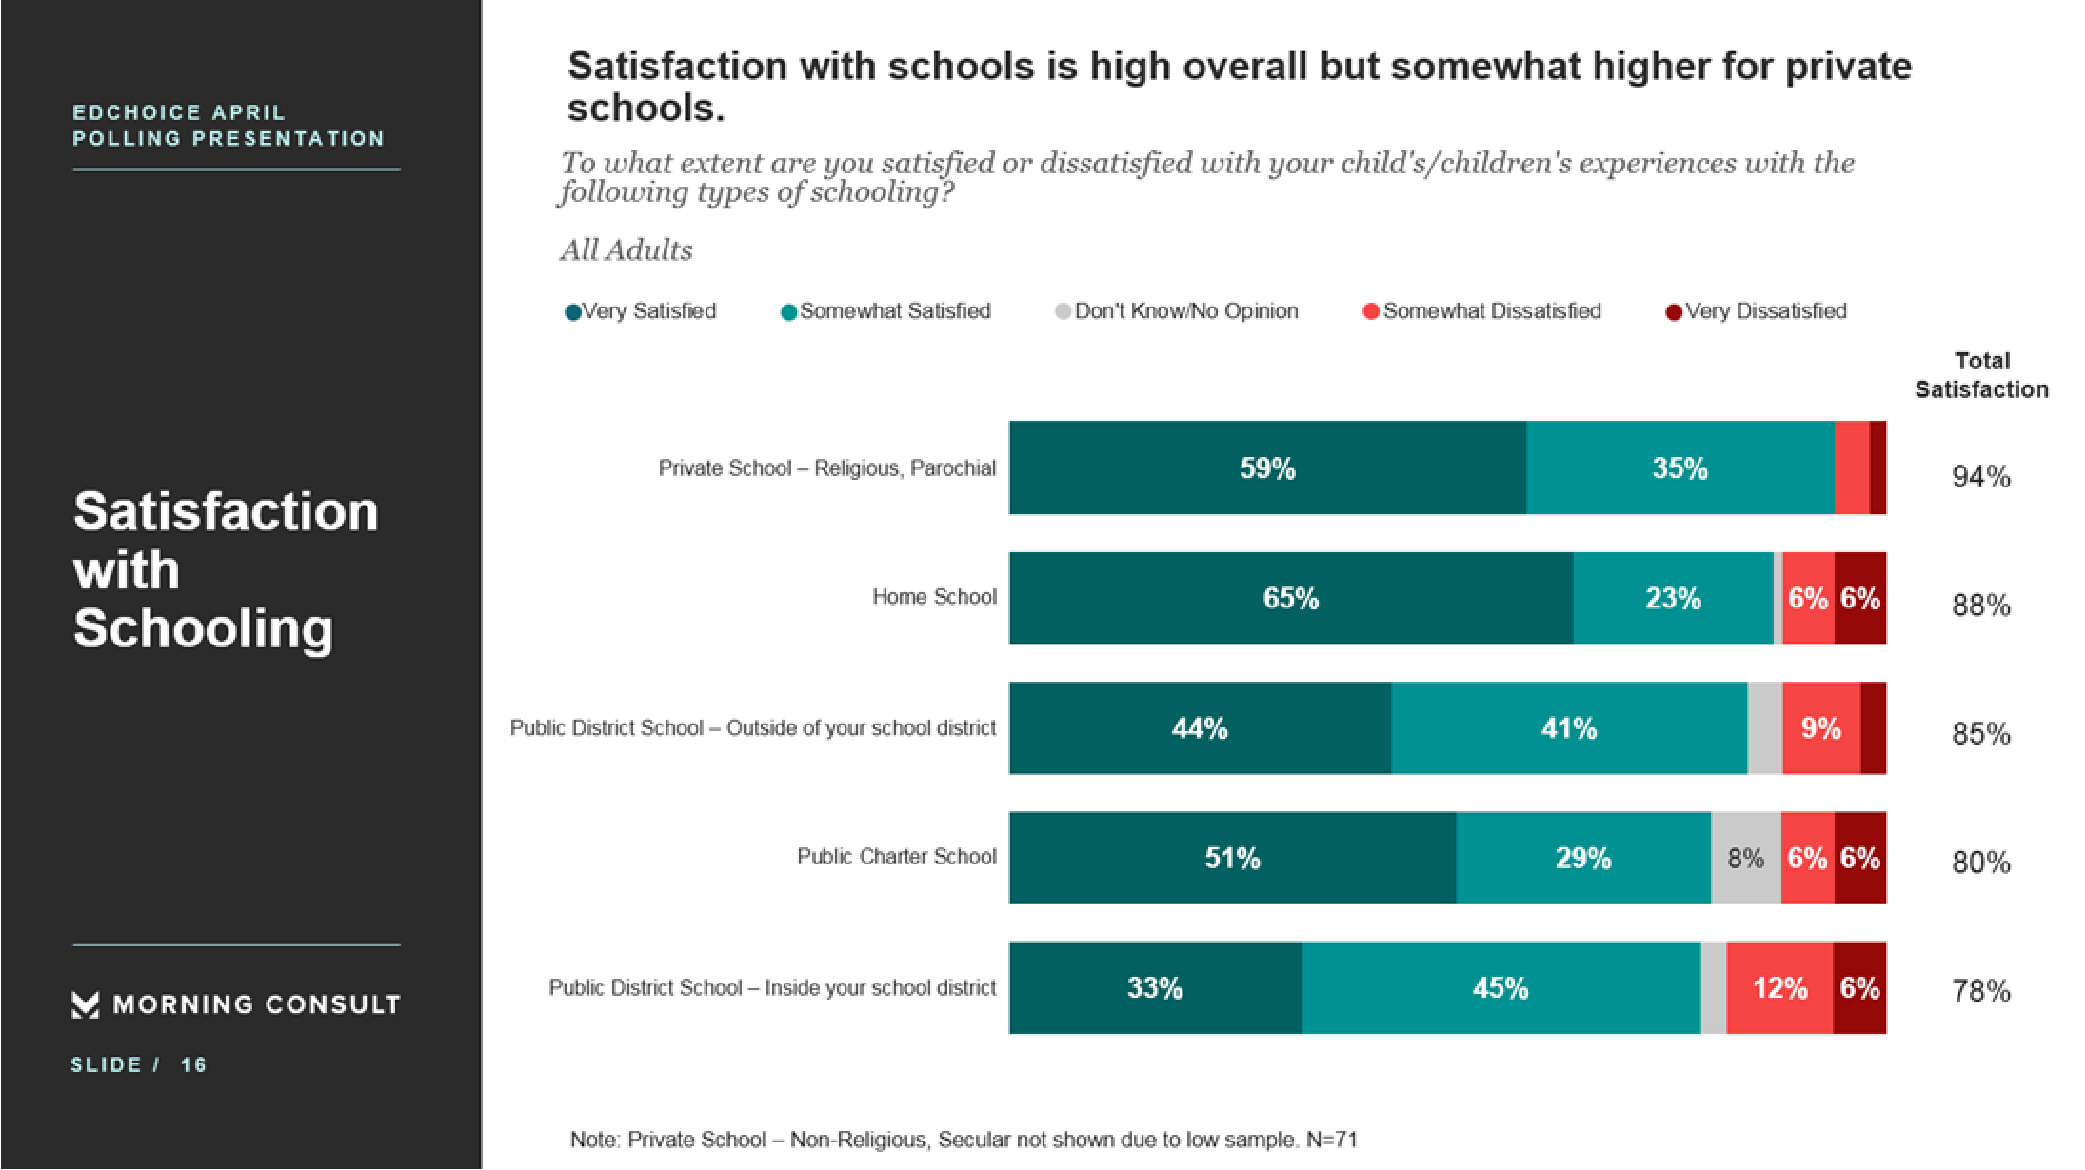
8. School parents give relatively higher marks based on their current experiences in private schools and homeschooling, compared to public district schools. This information is not shown on the dashboards yet, but you can find the school satisfaction results in our monthly reports here.
