EdChoice Public Opinion Tracker: Top Takeaways May 2022
June is here, folks. For America’s parents, we hope this means it’s time to lay back, relax, and enjoy a well-earned vacation. For many, though, it means closing the book on a tumultuous year of schooling amidst a global pandemic.
How do Americans feel about the past year, and how do they view the future?
These are the questions we tried to answer with the May wave of our Monthly Public Opinion Tracker, a survey of nationally representative sample of adults 18 and older (N=2,200, fielded May 12-17). With additional sampling, we obtained responses from a total of 1,119 parents of school-aged children. Take a look at what we found:
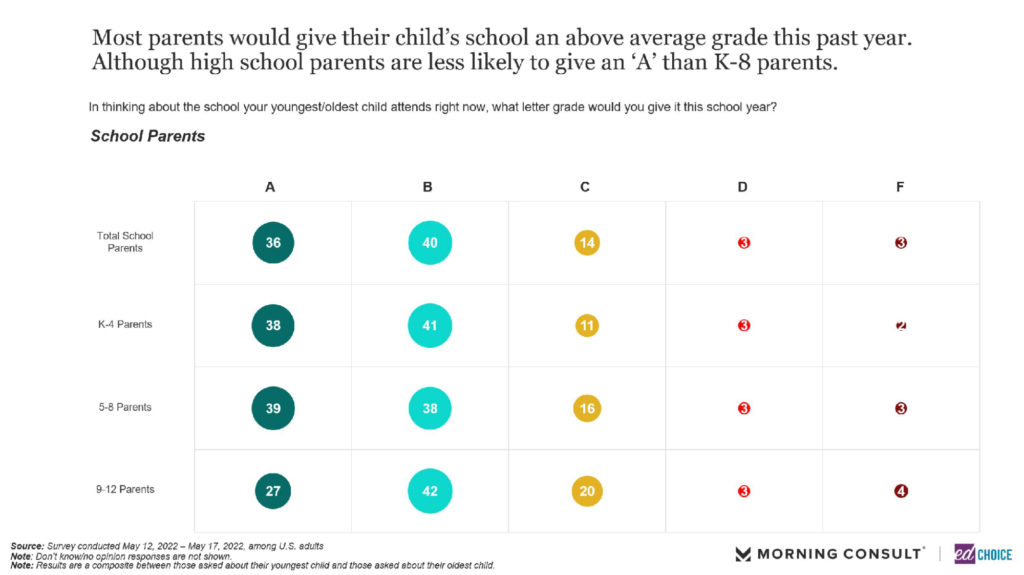
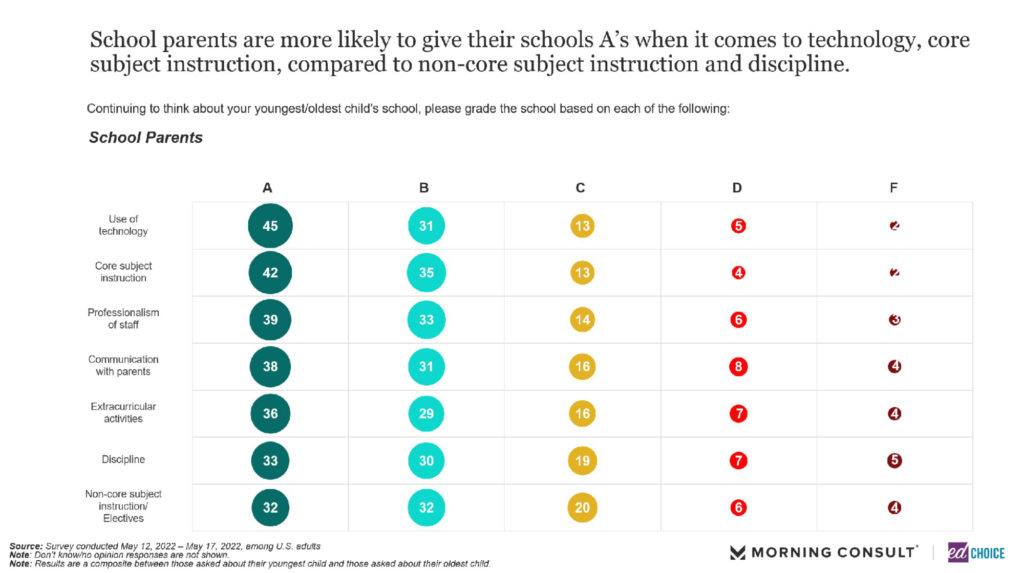
1. Most parents are satisfied with their child’s school. For the first time in our monthly polling, we asked parents to grade their child’s school. Overall, parents are happy with their child’s school, with more than 75 percent of parents willing to give a grade of A or a B. Parents of younger children (grades K-8) were slightly more satisfied, with nearly 80 percent of parents reporting an A or B grade. High school parents (grades 9-12) were slightly less happy with their child’s school, with a little more than two-thirds of parents offering an A or B grade. When taking a look inside the school, parents were most satisfied with the “use of technology” and “core subject instruction.”
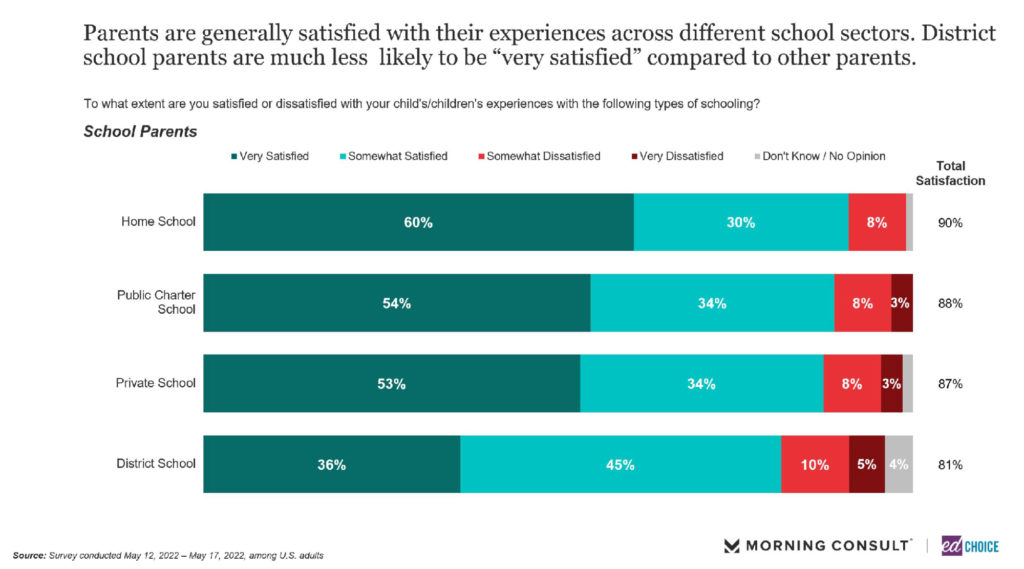
The majority of parents are satisfied with their child’s education, regardless of sector. Home school parents, public charter school parents, and private school parents report levels of satisfaction with their child’s schooling experience at 90 percent, 88 percent, and 87 percent, respectively. Compared to the other school sectors, district school parents are the least satisfied, though 81 percent of district school parents are happy with their child’s experiences at school. In the current school year, private school parents are the most optimistic when it comes to their child’s academic learning and emotional development.
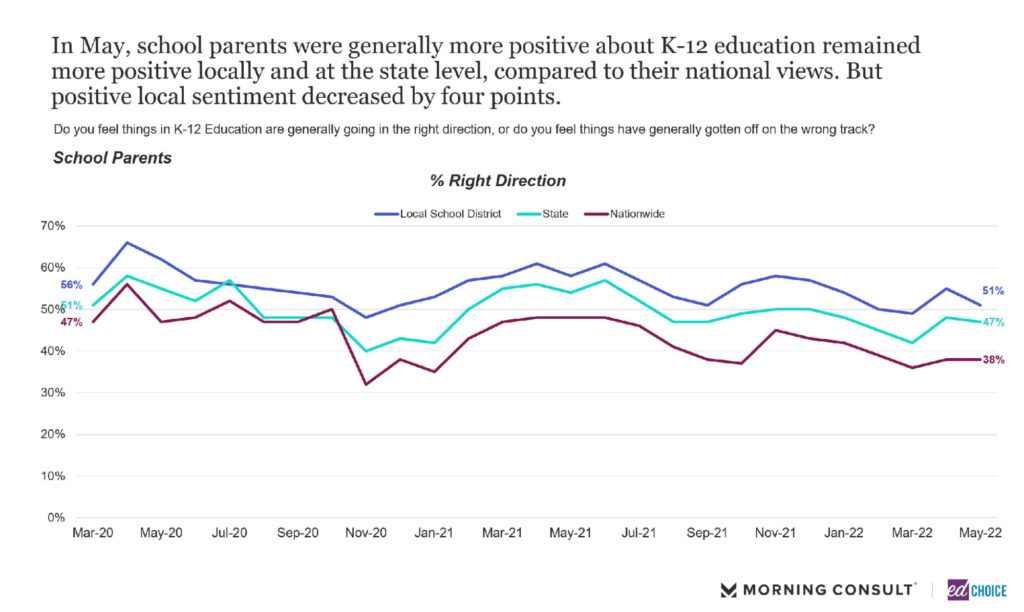
2. In May, parents are less positive about K-12 education – in their local views – compared to the previous month. After a 6-point increase in April, fewer parents believe K-12 education is headed in the right direction in May. That being said, more than half of parents still believe that education at a local level is heading the right direction.
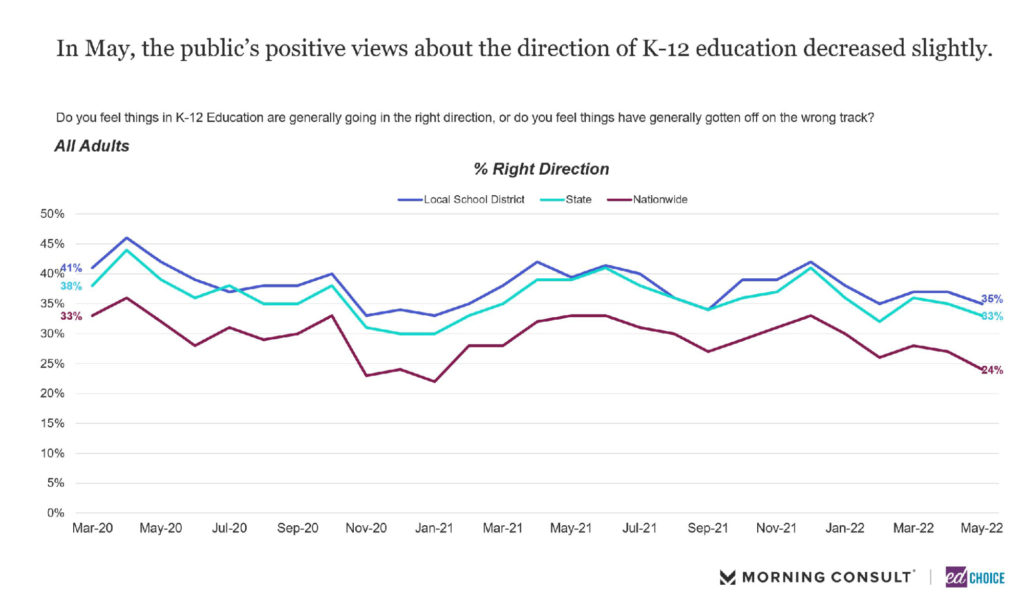
Parents become more skeptical when the question expands to include K-12 education’s outlook at the state and national level, with only 47 percent and 38 percent feeling optimistic, respectively. The general public is more pessimistic, however, with roughly one-third of all adults feeling K-12 education is headed in right direction at a local or state level. That proportion dips even further when assessing the direction of K-12 education at a national level, with only 24 percent of adults feeling optimistic.
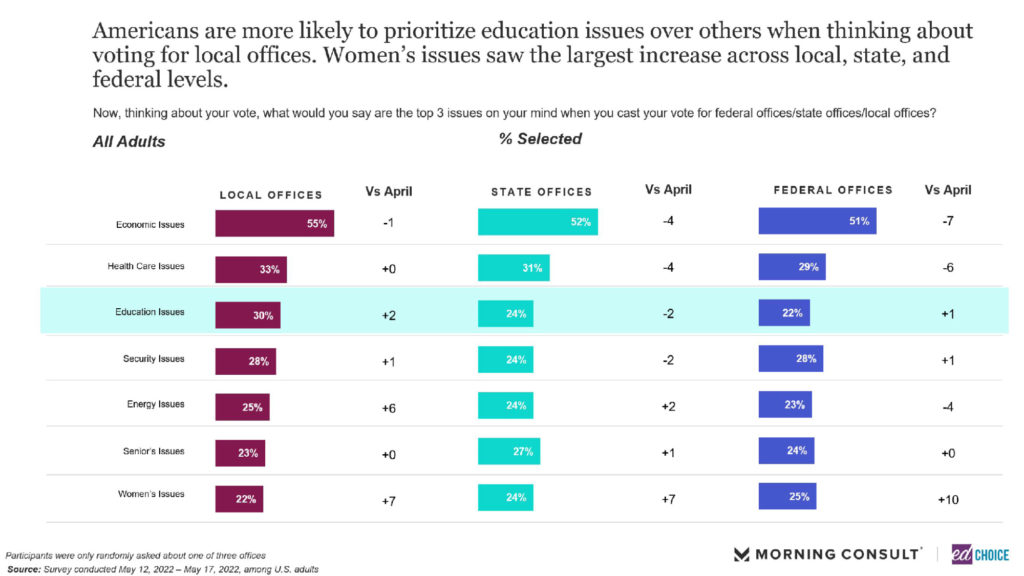
3. Education remains a high priority for voters in local elections. Education issues were the third highest priority among adults when thinking about local elections, trailing only economic and health care issues. Education issues ranked lower for state and national elections, however. When broken down by demographics, special education parents prioritized education most frequently, at 41 percent. Following closely behind special education parents were Hispanic parents, suburban parents, and parents in the western United States.
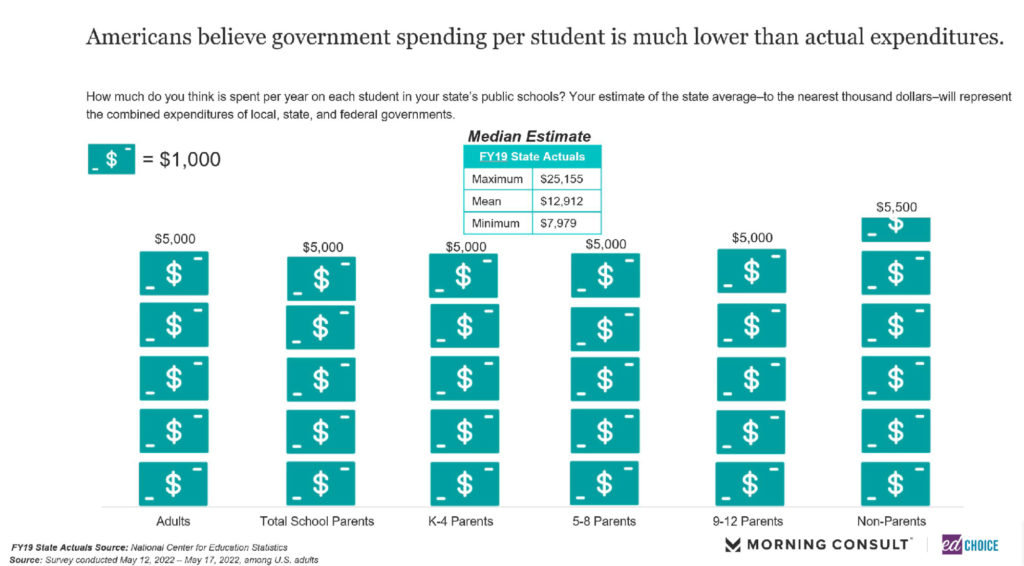
4. Americans are still drastically underestimating the average per-student expenditure in public schools. Parents and non-parents estimate that public schools are spending around $5,000 per-student annually. The actual average expenditure of public schools nationwide is nearly $13,000 per pupil.
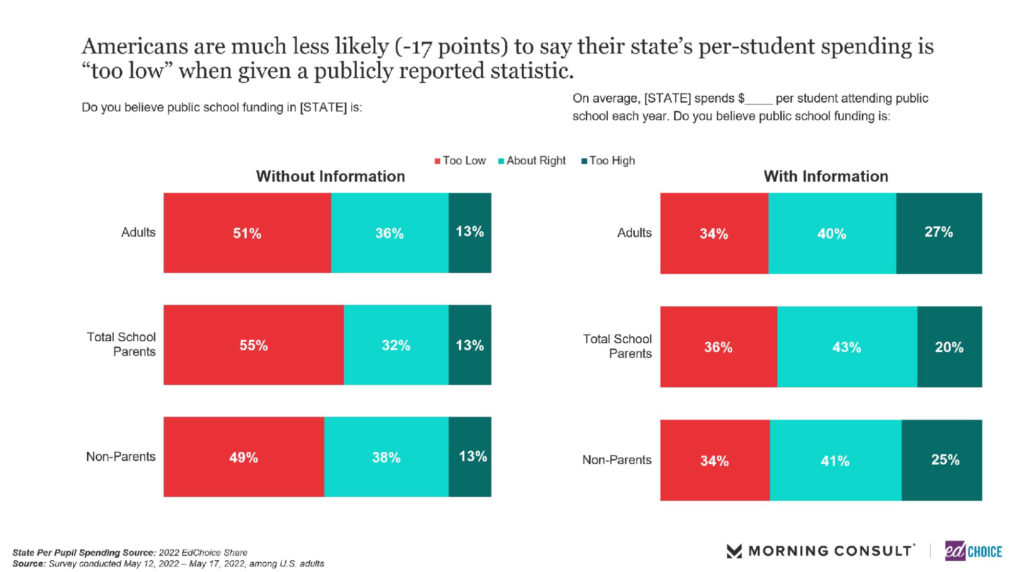
Without the actual amount supplied to them, more than half of all adults believe that per-student spending in public schools is too low. However, when shown the average expenditure per-student, the percentage of adults who believe spending per-student is too low drops to 34 percent.
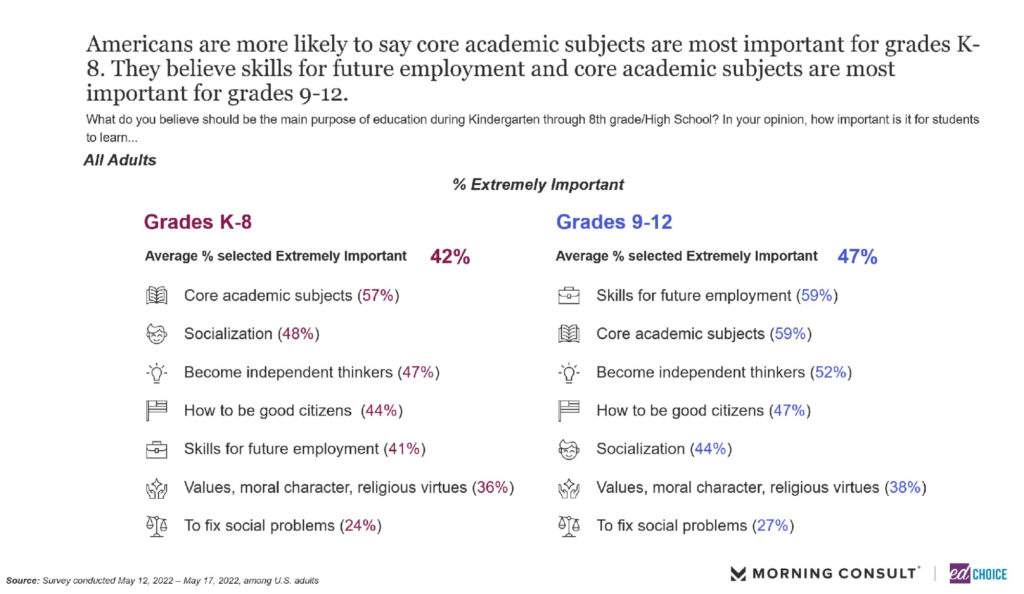
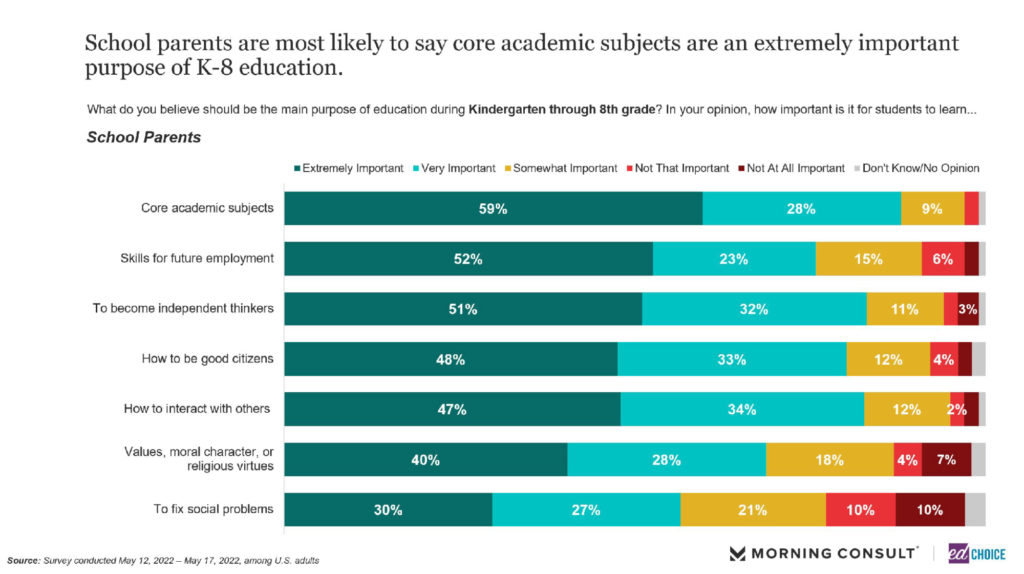
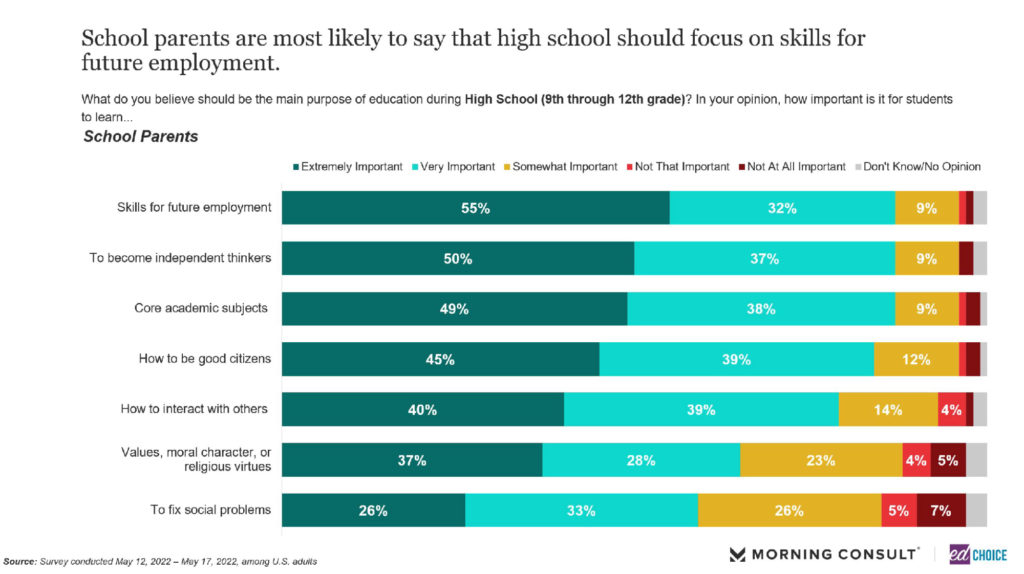
5. School parents and the general population are in alignment on the main purposes of K-8 and high school education. When asked about the main purpose of grades K-8, both school parents and the general public report core academic subjects as the most important, at 59 percent and 57 percent respectively. Focusing on high school education, skills for future employment garnered the most support from school parents and the general public, at 55 percent and 59 percent, respectively.
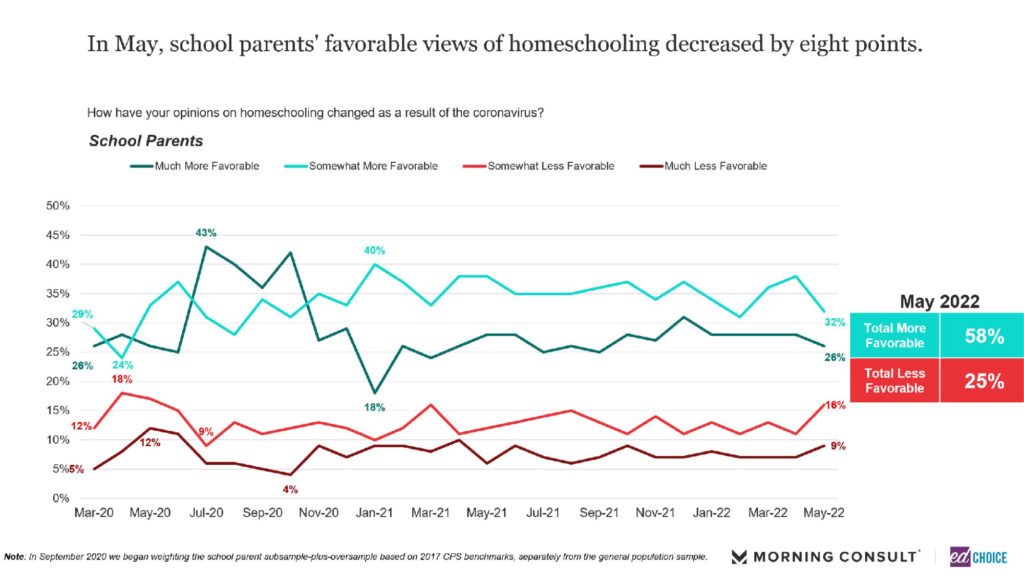
6. Homeschooling, learning pod, and tutoring interest decreased in May. Over the last two years, we’ve asked parents whether their opinions on homeschooling have changed as a result of the COVID-19 pandemic. We have seen parents express consistently high levels of favor towards homeschooling since the beginning of 2020, never slipping below 50 percent total favorability. This remains true in May, as we observed 58 percent total favorability from parents towards homeschooling. That being said, the percentage of respondents who said that they were favorable towards homeschooling fell eight percentage points in May.
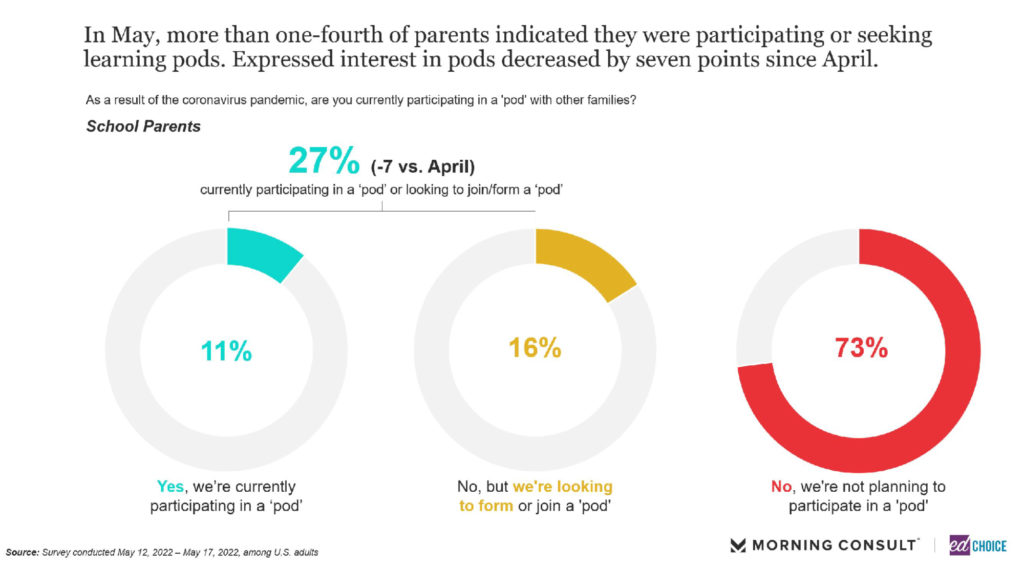
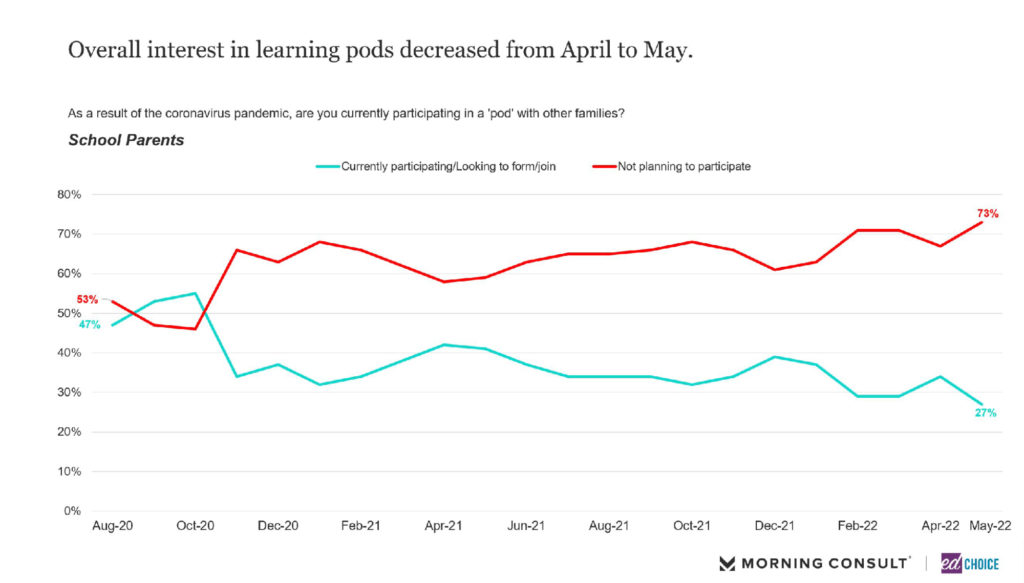
Learning pods, unlike homeschooling, have struggled to maintain high levels of support from school parents. Overall, participation and interest in learning pods rests slightly above 1 in 4 school parents, the lowest level we have observed since we began asking the question in August 2020. In May, we observed a 7-percentage point decrease in the number of parents either indicating that they were currently participating in a pod or were interested in joining one.
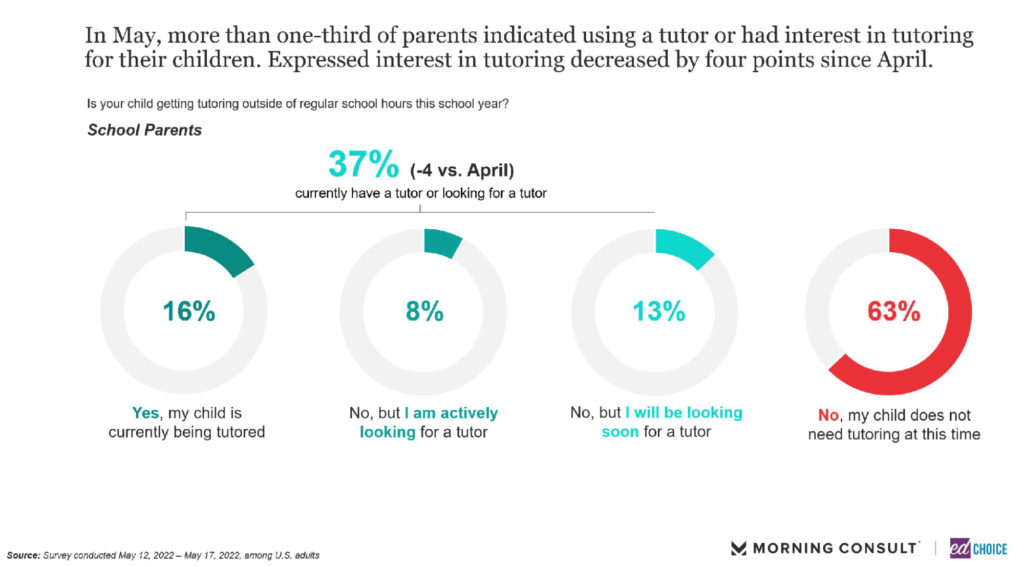
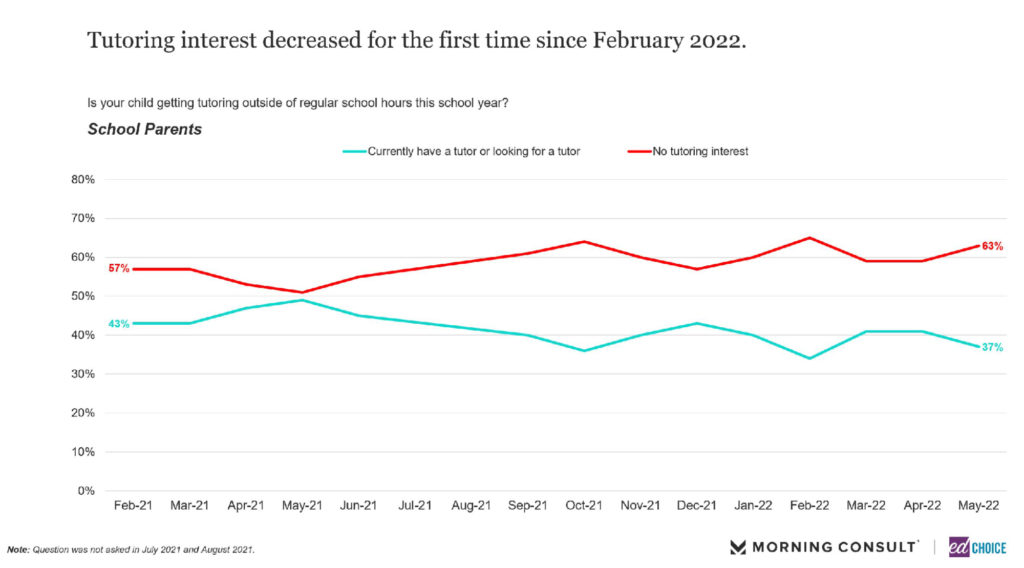
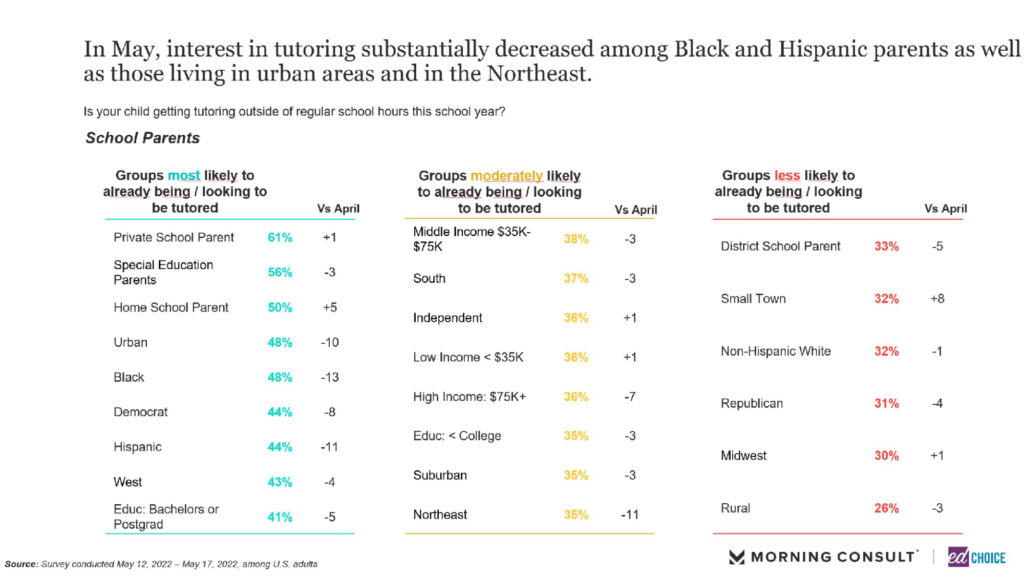
Tutoring was not exempt from the declining interest in May, either. Participation and interest in tutoring decreased slightly (4 percent) to 37 percent among school parents. Since we began asking the question in February of 2021, 37 percent support is nearing the lowest level we’ve observed. Private school parents are most likely to participate or show interest in tutoring, with 61 percent indicating that they either had already hired a tutor or were looking to.
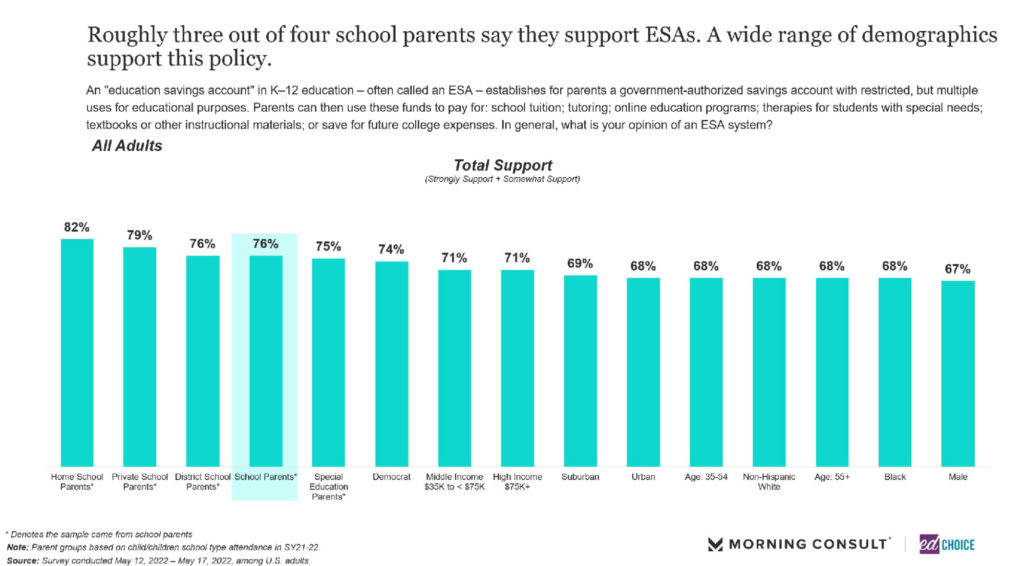
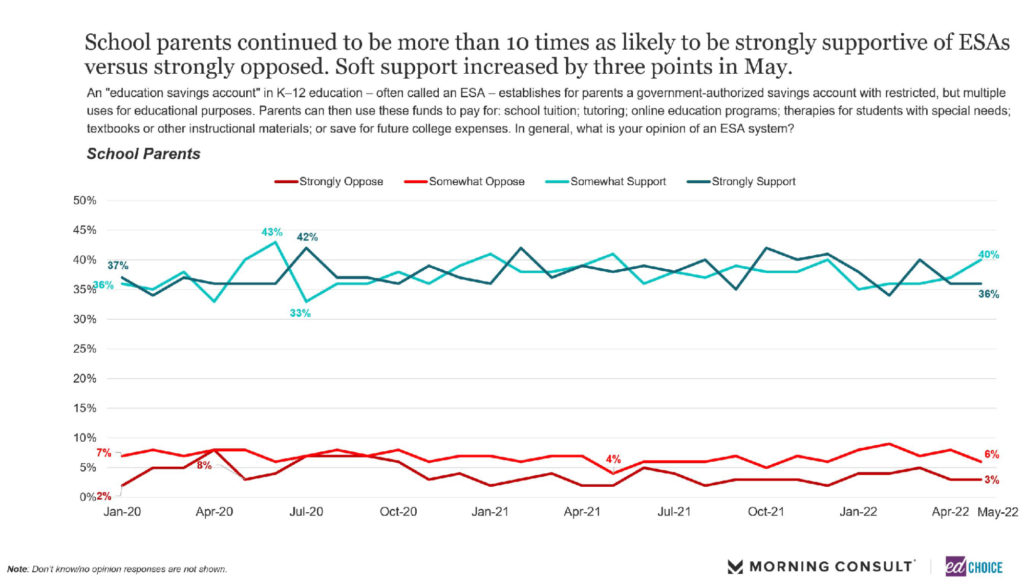
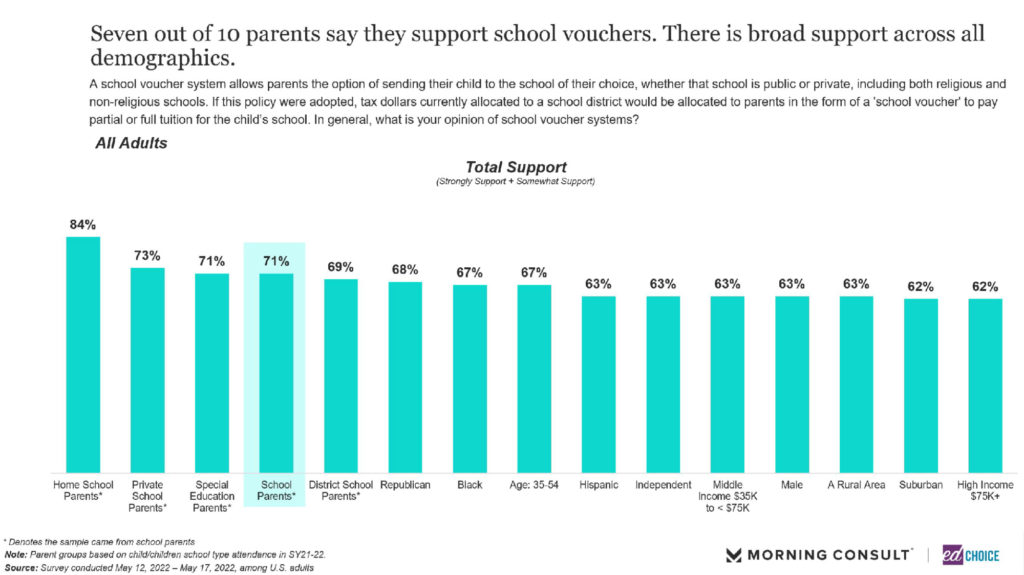
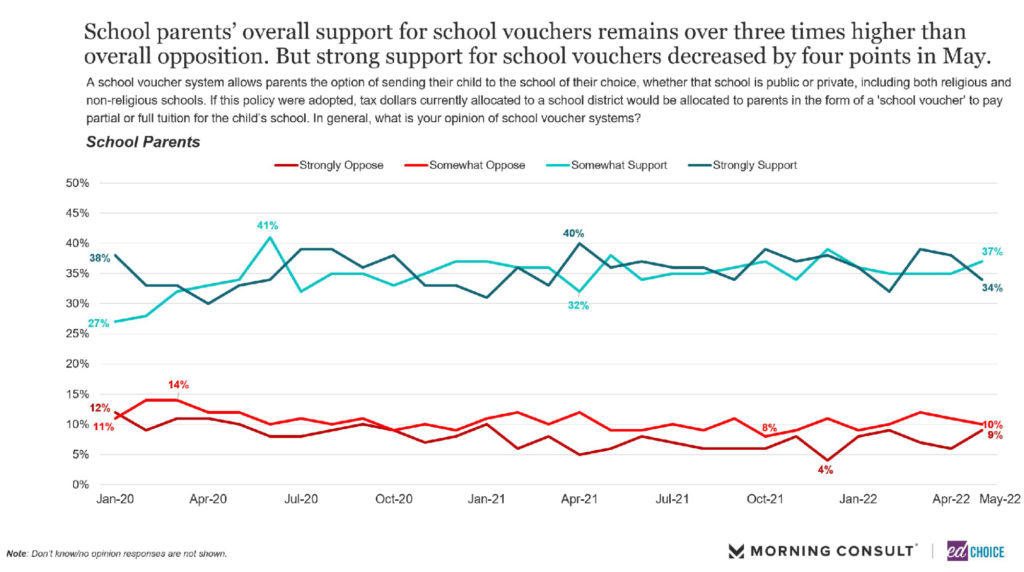
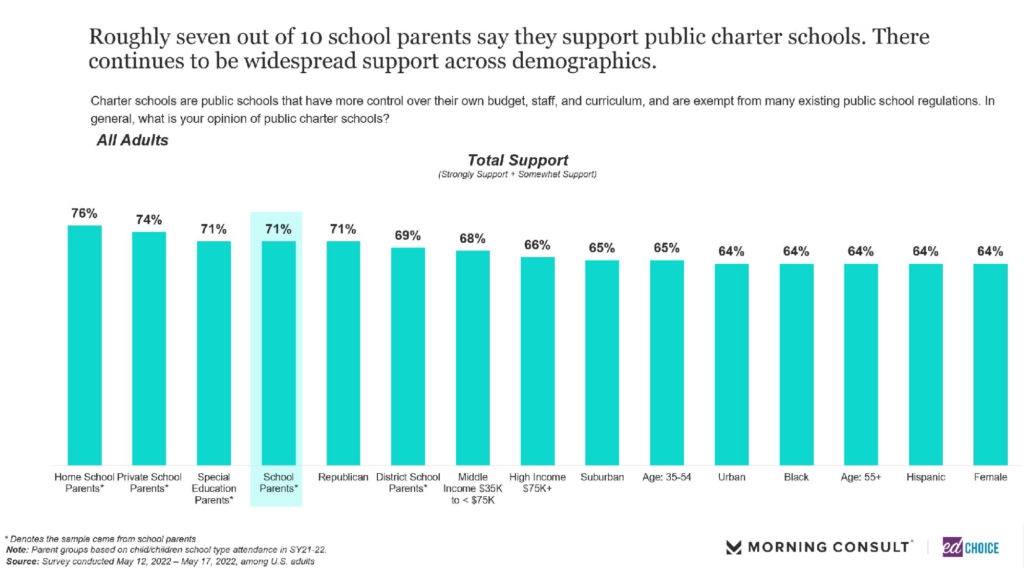
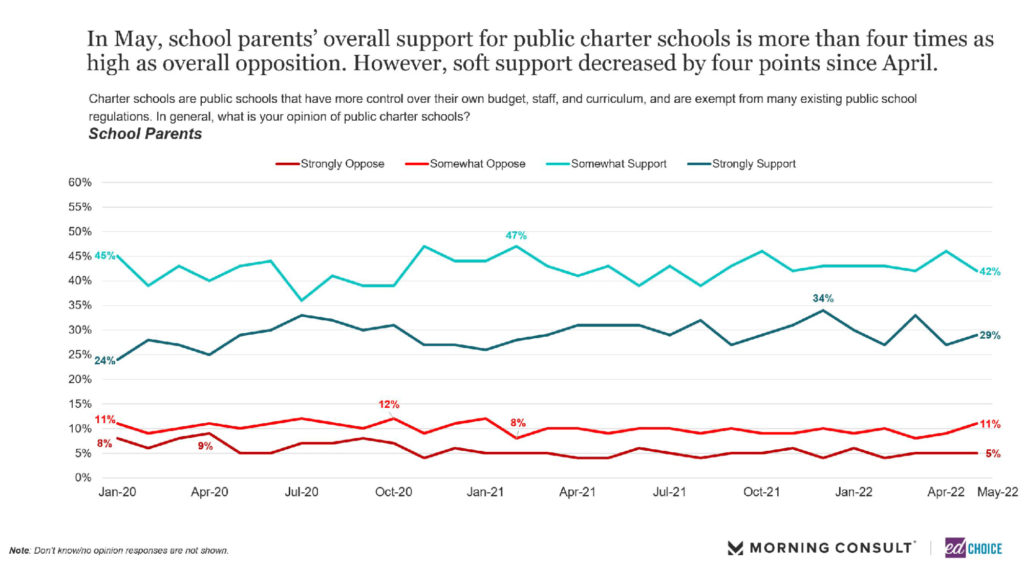
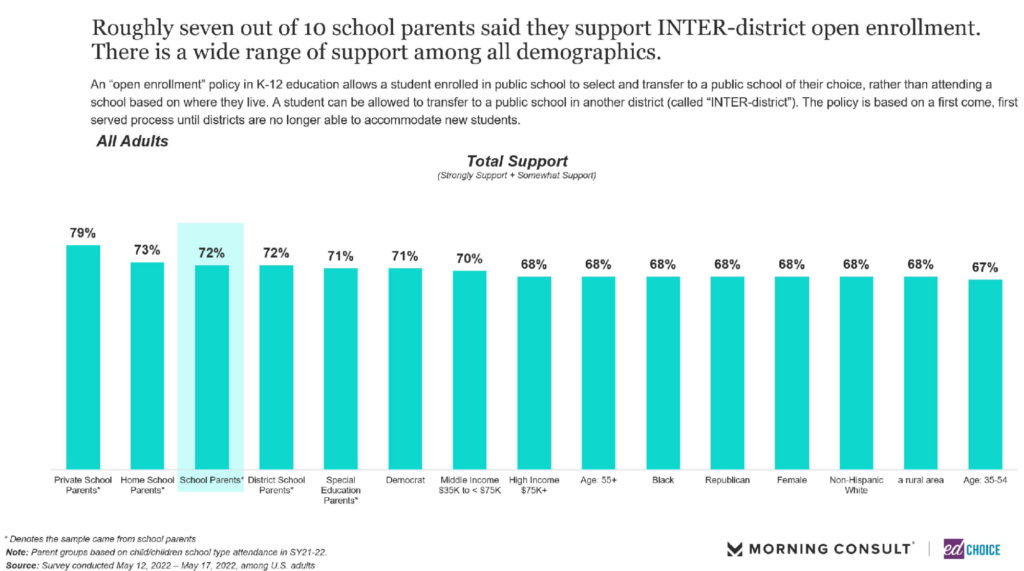
7. School choice policies continue to receive high levels of support. School choice policies being popular with the majority of school parents and the general public has been the model of consistency within our polling. The four major school choice policies – Education Savings Accounts (ESAs), Vouchers, Charter schools, and Open Enrollment – maintained high levels of support in the high 60s and 70s. Each policy is supported by at least two-thirds of all adults. School choice policies remain especially popular among school parents, across many demographics. For example, Democrats are one of the most supportive groups towards ESAs, at 74 percent. School vouchers enjoy a high level of support from Republicans and African Americans, at 68 and 67 percent, respectively.
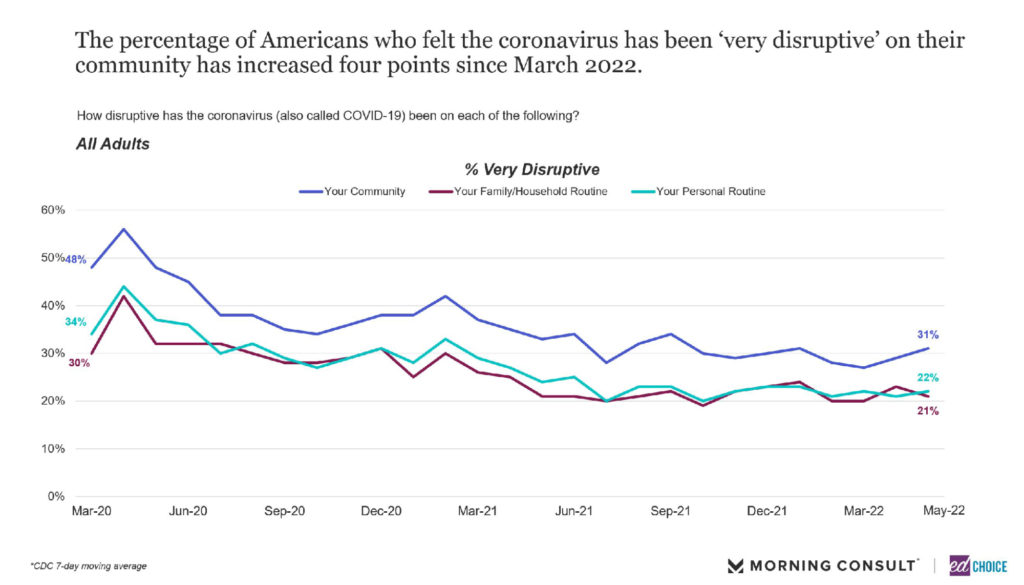
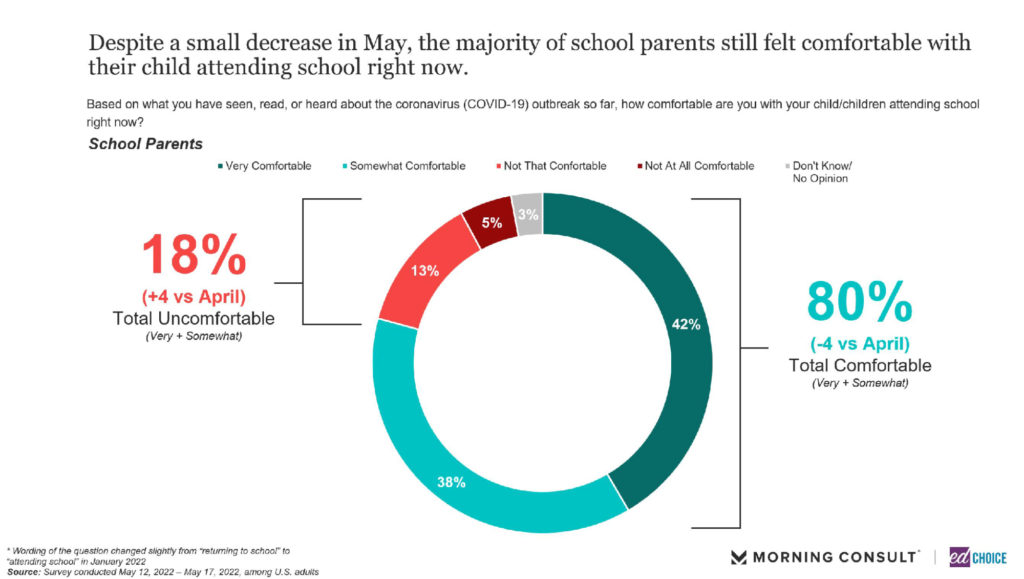
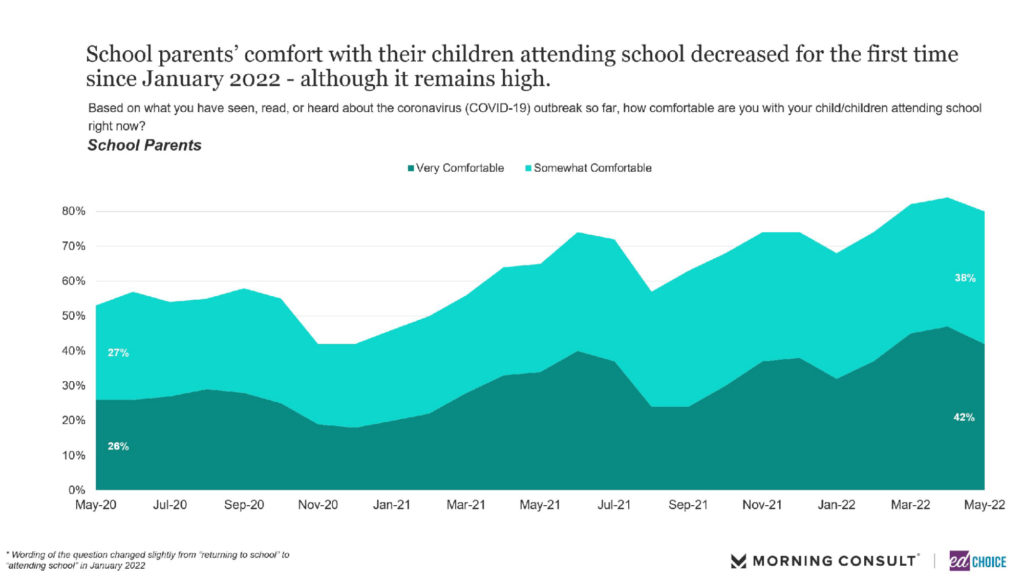
8. More Americans feel COVID-19 has been disruptive in their community compared to March. COVID-19 concerns have been decreasing steadily since the last few months of 2021, yet nearly one-third of all adults feel as though their community has been disrupted by COVID-19. We observed a subtle increase in COVID concerns when we asked school parents how comfortable they were with their child attending school. In April, parents’ comfort with their child attending school reached a new high, 84 percent. In May, however, the level of comfort among parents dipped slightly to 80 percent. This is not unusual, as each time our polling recorded parents’ comfort reaching a new height the subsequent month’s polling would find a slight decrease in parents’ comfort.
