Mapping Indiana’s Public District School Choice Transfers
Hoosier families have many options when it comes to K–12 education. While the state’s private school choice programs have garnered plenty of local and national headlines, the majority of Indiana students move schools using a different system: open enrollment.
Earlier this year, the Indiana Department of Education released its first ever Public Corporation Transfer Report showing how many students in each district exercised their public school choice in Fall 2017. I’ve used the data in that report to create maps that show which districts are gaining and losing students—and where those students are going.
According to the most recently available data from the National Center on Education Statistics, some homeschooler estimates and my own calculations, 81.7 percent of Hoosier students attend a public district school. The remaining students pay for private school (8.7%), use a voucher or tax-credit scholarship to attend a private school (3.4%), attend a charter school (3.2%) and are homeschooled (2.9%).
Indiana is one of 46 states that have open enrollment policies that allow for public school choice to exist beyond moving school districts. Any school district in Indiana may voluntarily enact a policy for accepting or rejecting transfer applications, and Indianapolis Public Schools (IPS) mandates that schools in the district must allow students to transfer from anywhere else in the district. Students can transfer out of their resident school district based on:
- an agreement between the parent(s) and the attending district,
- an agreement between the resident school district and the attending district,
- a “better accommodation” student transfer agreement under IC 20-26-11-5 between the resident school district and the student’s parent(s),
- a “better accommodation” order by the State Board of Education
- state obligations or
- placement by county welfare offices, state courts, state licensed child-placing agencies, etc.
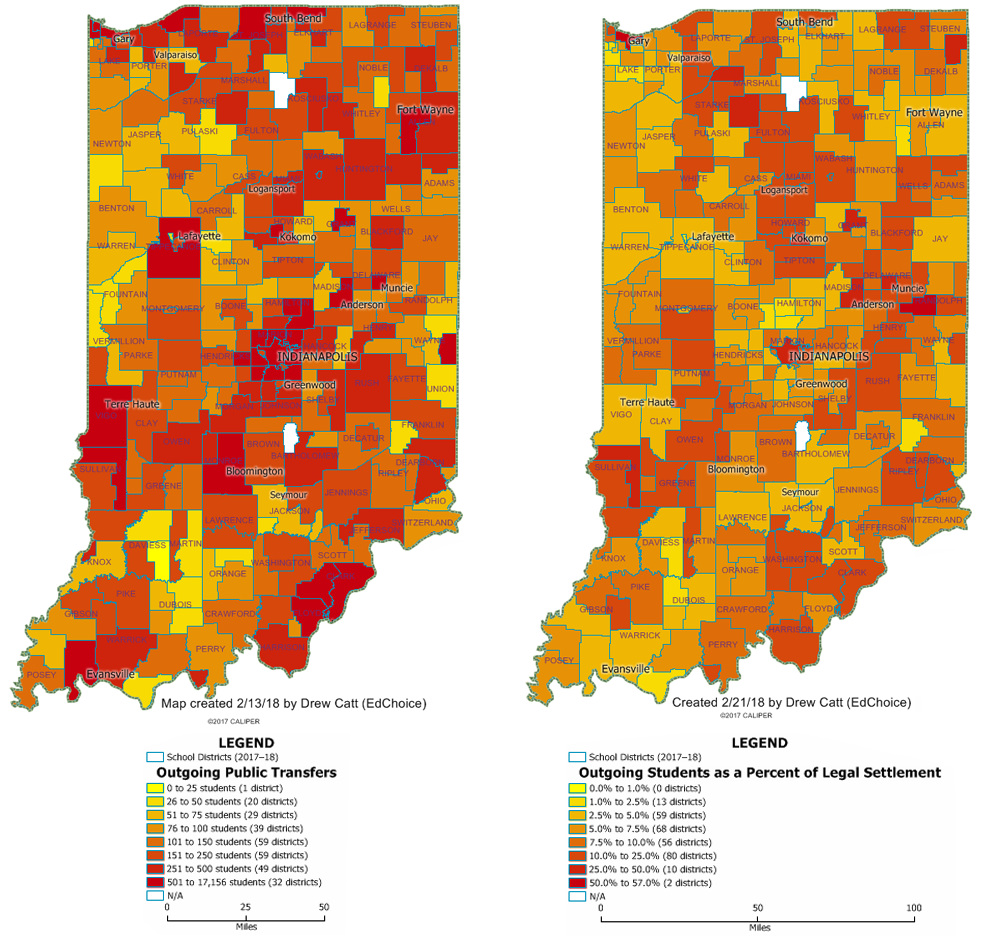
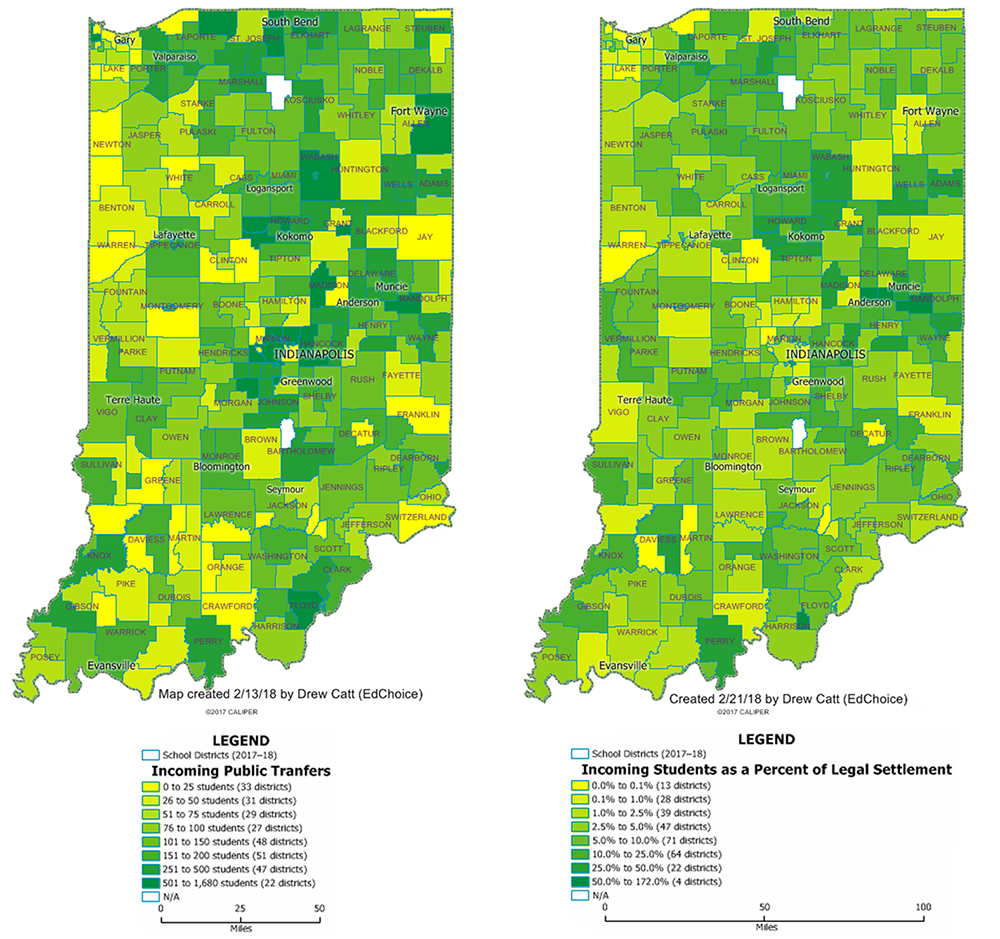
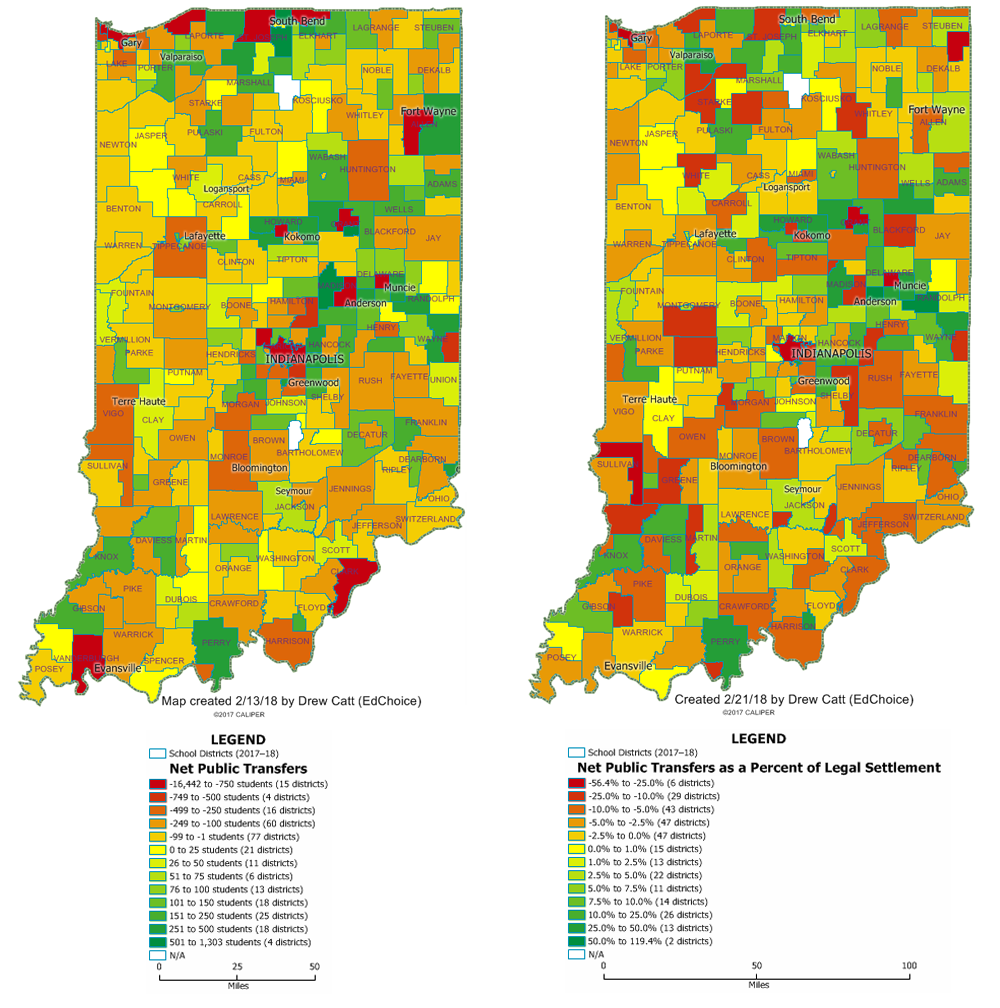
Below are three maps showing which Indiana districts students are choosing to leave, which districts students are choosing to enter and the net enrollment effect on each district.
First, I examined districts with students who chose to leave their assigned public school.
The 289 public school districts in the transfer report had 99,840 students transfer out of district.
Here are the top five districts at each extreme:
| 1 | Indianapolis Public Schools | 17,156 |
| 2 | Gary Community School Corp | 6,776 |
| 3 | South Bend Community School Corp | 3,975 |
| 4 | Anderson Community School Corp | 2,517 |
| 5 | Muncie Community Schools | 2,117 |
| 285 | North Daviess Com Schools | 29 |
| 286 | Shoals Community School Corp | 29 |
| 287 | South Spencer County School Corp | 29 |
| 288 | West Lafayette Com School Corp | 27 |
| 289 | Barr-Reeve Community Schools Inc | 9 |
Notably, 2,692 students who left Indianapolis Public Schools attended an IPS Innovation Network Charter School.
Next, I examined the districts that students chose to switch to thanks to Indiana’s open enrollment policy.
The 289 public school districts in the transfer report had 53,423 students transfer into the district. IDOE defined outgoing public transfers (students leaving) as, “Students with legal settlement in the listed school corporation who are enrolled in and attending a public school outside the school corporation,” and defined incoming public transfers (students entering) as, “Students with legal settlement outside the school corporation who are enrolled in and attending the listed school corporation.” The main difference, as far as I can tell, is that charter school students (44,112 students left their resident district to attend charter schools in Fall 2017) are included in the former but not the latter.
Here are the top five districts receiving public transfers:
| 1 | Penn-Harris-Madison School Corp | 1,680 |
| 2 | Beech Grove City Schools | 1,134 |
| 3 | M S D Lawrence Township | 1,126 |
| 4 | M S D Wayne Township | 905 |
| 5 | Frankton-Lapel Community Schools | 853 |
There were 12 school districts that did not receive any public transfer students:
| Clinton Central School Corporation |
| Crothersville Community Schools |
| Gary Community School Corp |
| Greensburg Community Schools |
| Loogootee Community School Corp |
| M S D Pike Township |
| M S D Warren County |
| M S D Warren Township |
| Michigan City Area Schools |
| School City of East Chicago |
| School Town of Speedway |
| Washington Community Schools |
When taking into account all of the students who left and came into a district, I found some districts were losing more students than they were gaining (see charter school explanation above) and vice versa.
Here are the top five districts at each extreme:
| 1 | Penn-Harris-Madison School Corp | 1,303 |
| 2 | Beech Grove City Schools | 932 |
| 3 | Frankton-Lapel Community Schools | 786 |
| 4 | Mississinewa Community School Corp | 507 |
| 5 | Concord Community Schools | 462 |
| 285 | Muncie Community Schools | -1,938 |
| 286 | Anderson Community School Corp | -2,493 |
| 287 | South Bend Community School Corp | -3,908 |
| 288 | Gary Community School Corp | -6,776 |
| 289 | Indianapolis Public Schools | -16,442 |
It’s worth noting that roughly three out of five districts in Indiana (60%; 173 out of 289 districts) had a net loss of public transfer students.
According to the FAQ that accompanies the data set:
“There are many reasons students attend a school outside their corporation of legal settlement. [Including] open enrollment opportunities, school employees enrolling their children where they work, or any other scenario where the parent chooses to enroll their student in a school other than their corporation of legal settlement. [It also] includes students that attend a different school due to an agreement between the two schools. This includes placements due to special education programs, alternative programs, or any other placement where the primary agreement is not between the parent and enrolled school.
The data show public school choice is by far the most popular choice option for families. As a researcher of school choice options, that’s not a bad thing, nor is it unexpected. Families know their children’s needs best, and the evidence supports that they will take action when empowered to do so. School leaders and policymakers across the nation would do well to embrace school choice, gather feedback and be nimble and responsive to their students and their families.
Do you have any data that you’d like to see mapped? Contact our team at research@edchoice.org.


