New Poll Shows Americans Are More Than A Little Confused About K–12 Education
The 2019 Education Next Poll is out, and we wanted to take a minute to highlight some of the key findings related to school choice and K–12 education in America.
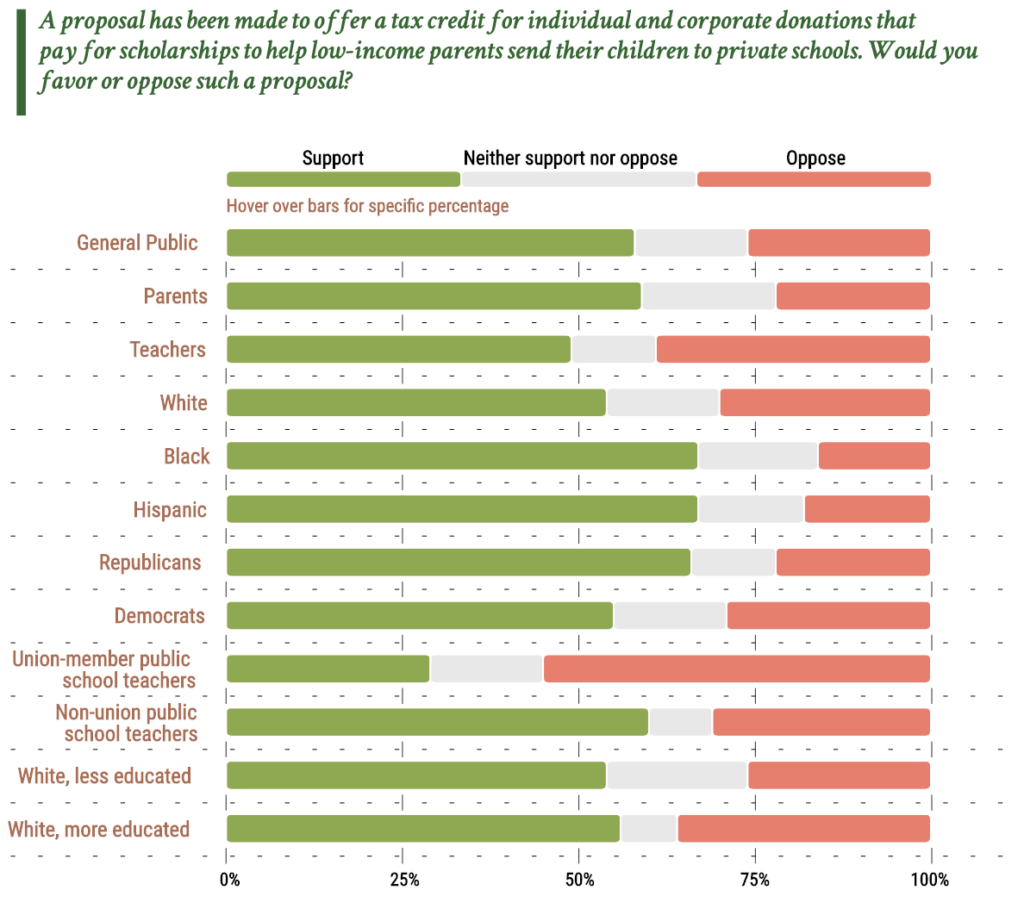
The big takeaway? Support for private school choice programs has increased, especially when it comes to tax-credit scholarships, which clock in at 58 percent support among all respondents.
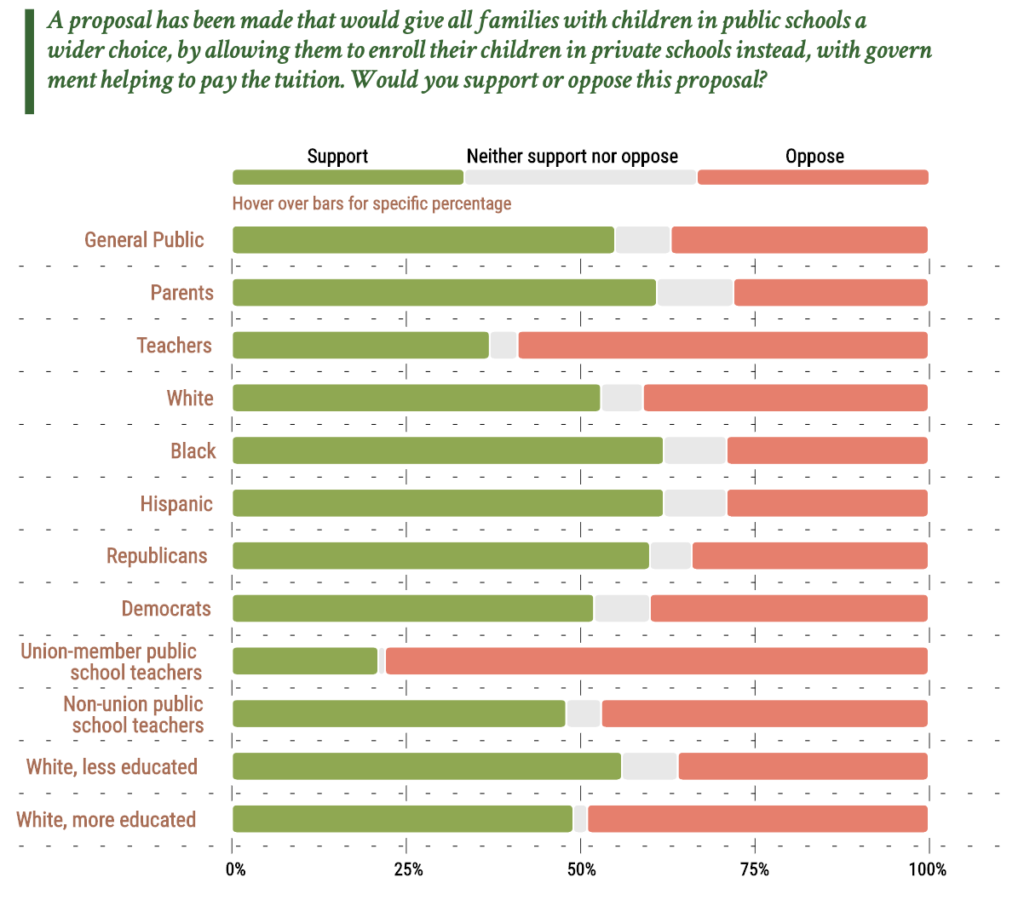
A majority of respondents—55 percent—also support universal vouchers, which would provide state funding to all families to help them pay for private school tuition. Interestingly, as in past years, support for means-tested vouchers that would only help low-income families was lower—49 percent—than support for universal vouchers.
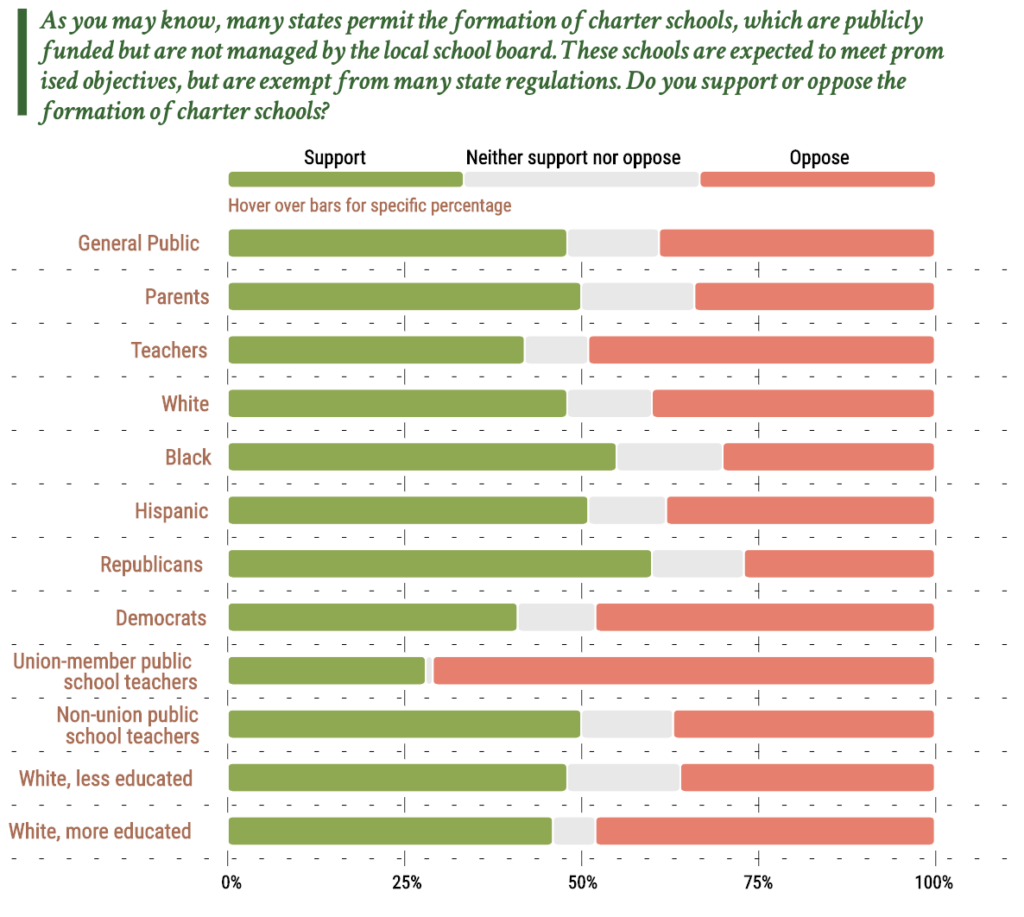
There is some less-rosy news on the school choice front: While support for charter schools has rebounded from two years ago, it’s still below 50 percent overall, and opposition appears to be galvanizing along party lines.
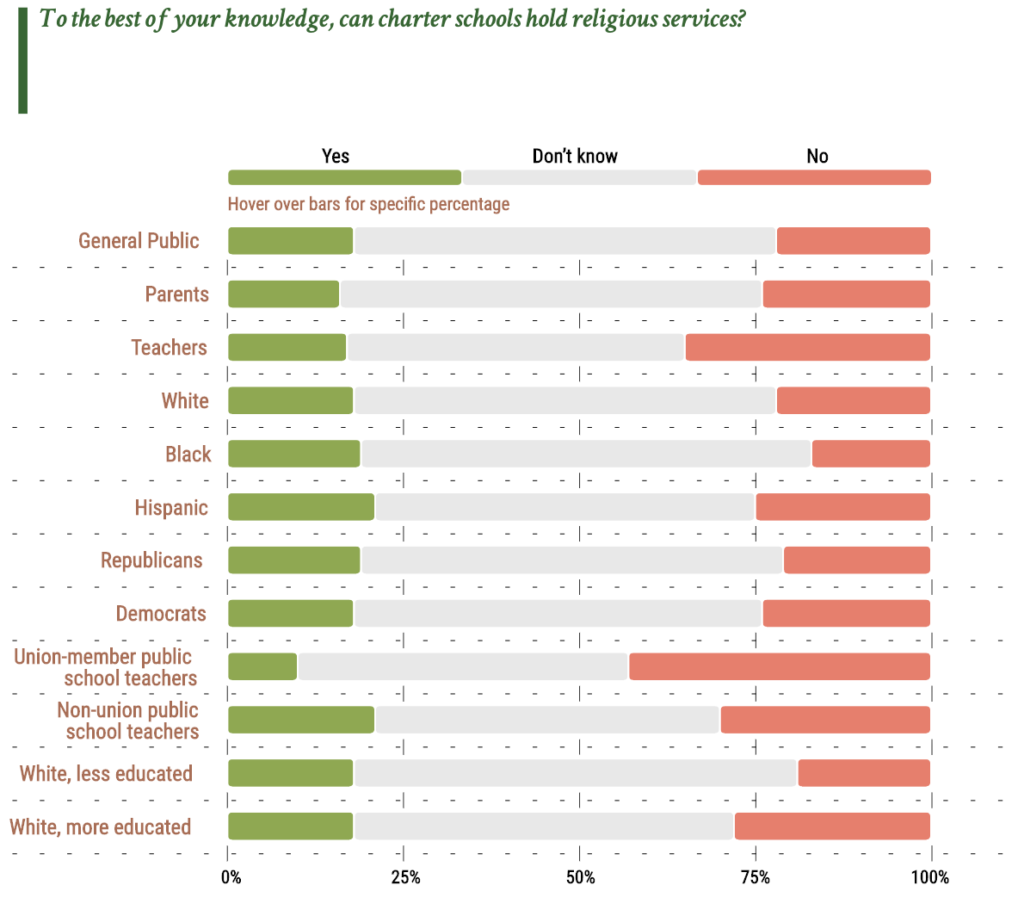
Part of the problem for charters may be that people are still woefully confused about what they are and how they operate—almost one in five respondents (18 percent) believe charters can have a religious component, which is untrue.
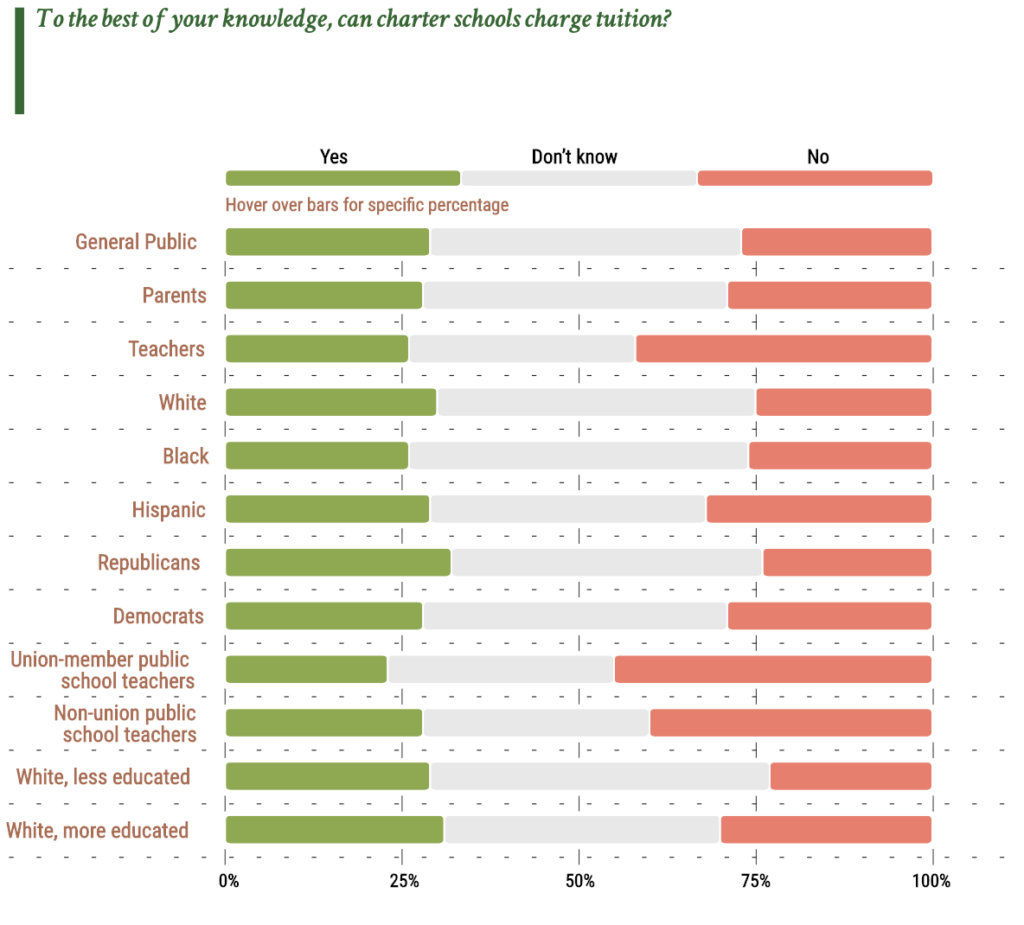
Almost one-third (29 percent) of respondents believe charter schools can charge tuition, which also is untrue.
Many of the findings in the EdNext poll mirror what we have found in our annual Schooling in America survey, the 2019 version of which will be released later this year.
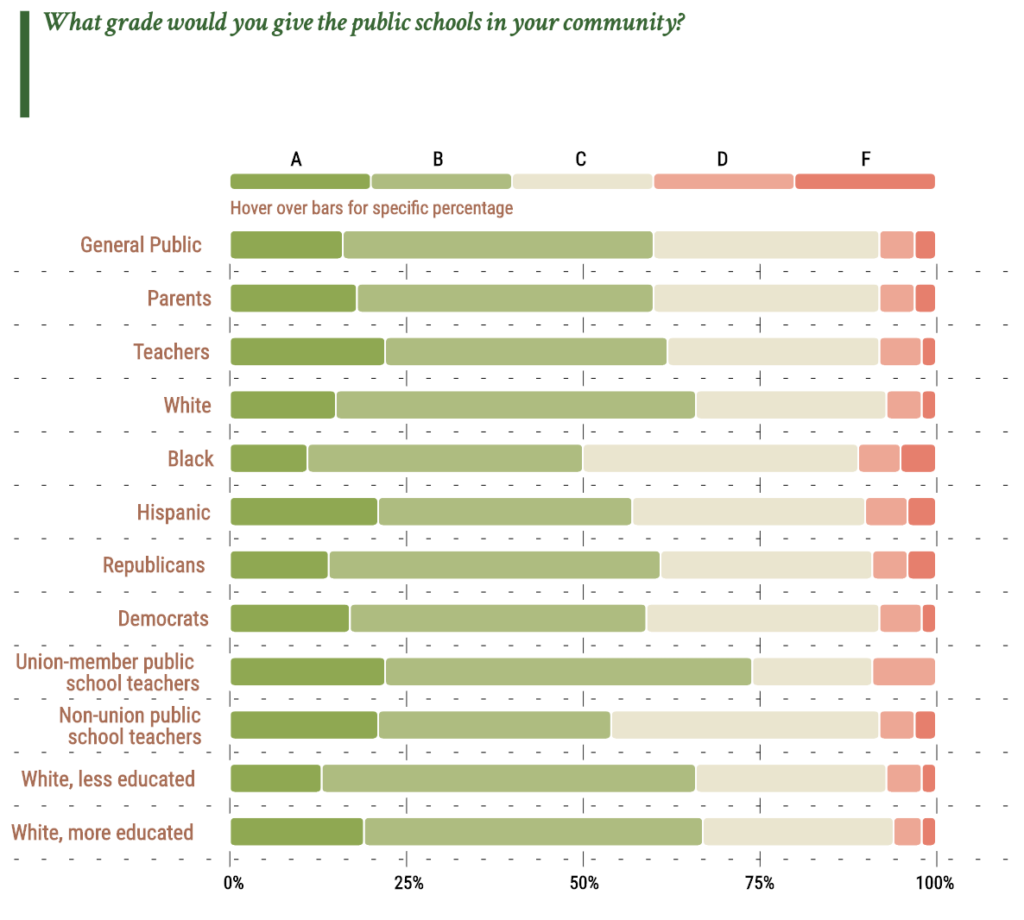
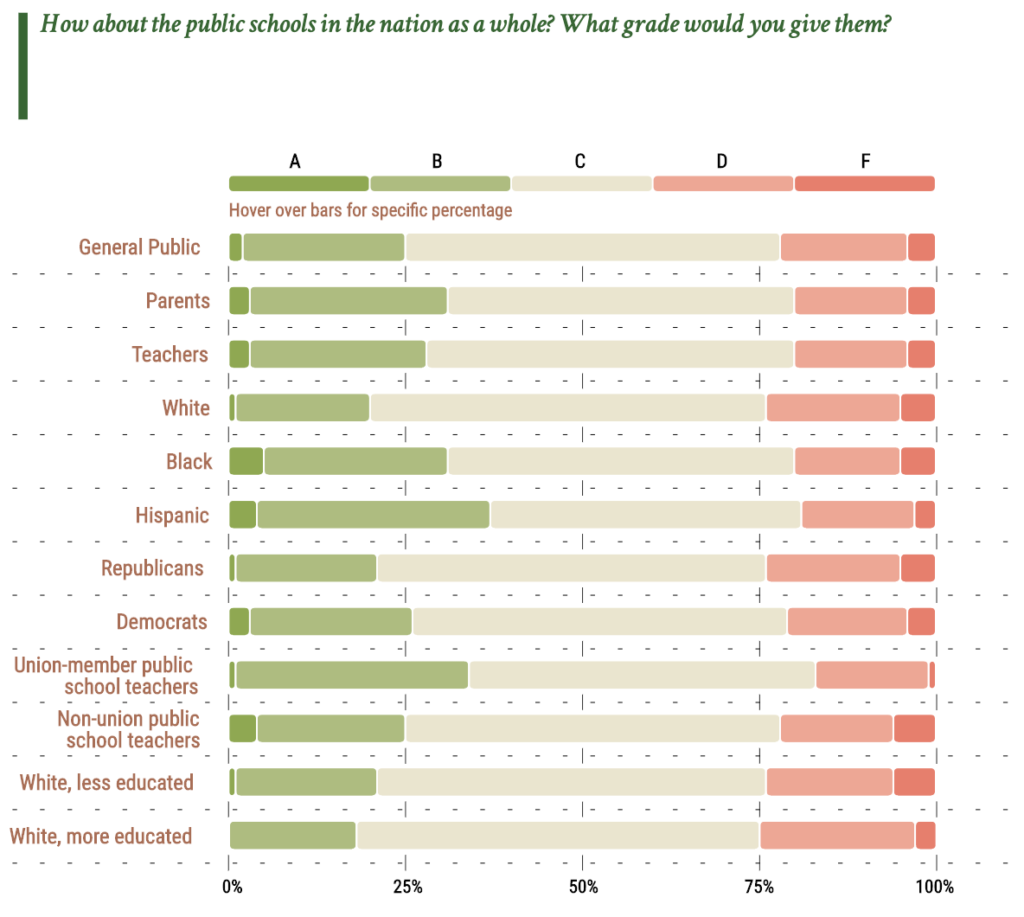
Most notable is the theme that people love their local schools but think the nation’s public schools aren’t doing so well. (In politics, this is called Fenno’s Paradox—plenty of people hate Congress but have a sunnier view of the person elected to represent them there.)
Among all respondents, 60 percent would assign their local schools an “A” or “B” grade with only 8 percent assigning a “D” or “F” grade.
But when you ask about the national K–12 landscape, approval drops drastically—only 24 percent would assign an “A” or “B” grade to public schools with 22 percent assigning a “D” or “F.”
Opponents of school choice often try to make their case using a faulty funding argument: When families choose, a public school loses money. (In reality, funding follows a child to whatever school they choose, and in some cases, states continue to fund public schools even after a student uses a choice program to select a non-public option.)
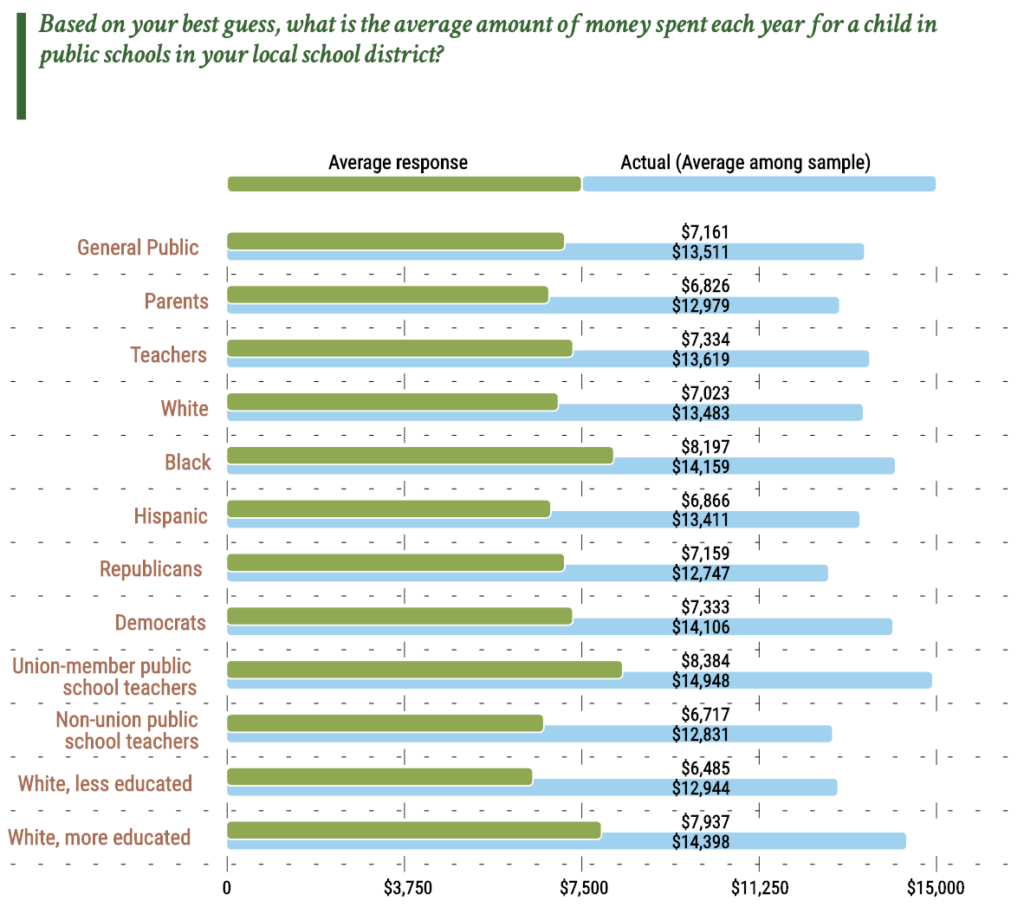
What’s ironic about this argument—and borne out in the EdNext poll—is that Americans actually have no clue how much money public schools receive. Among certain sub-groups, estimates are off by almost 50 percent.
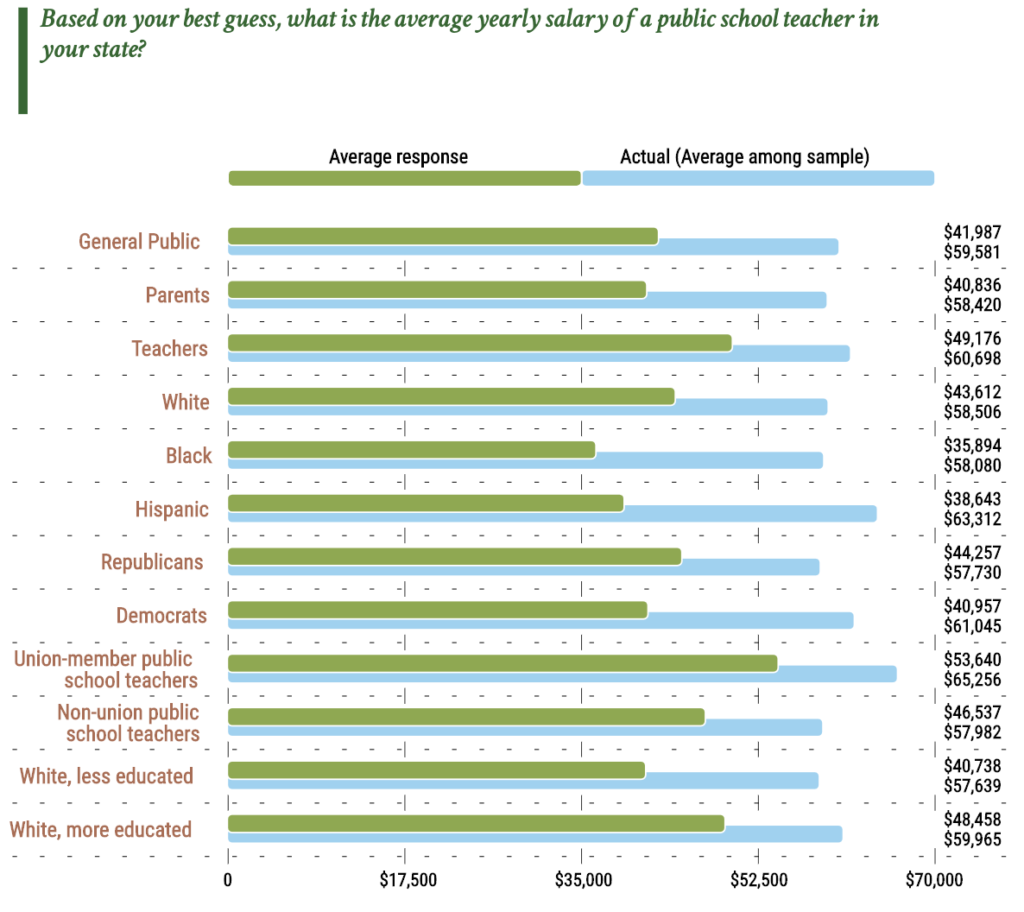
Similarly, despite growing support for educator raises, respondents across the board and in every sub-group underestimated how much public school teachers are paid:
There are plenty of additional interesting questions in the poll, but we wanted to close with a few items that surprised us.
- Only 35 percent of all respondents said they think high school students should take classes that prepare them for college; the remaining 65 percent said they’d prefer to see high schoolers taking courses that prepare them for the workforce following graduation.
- The general public doesn’t hate standardized testing, but teachers do. Seventy-four percent of respondents (and 73 percent of parents) said they support the federal governmenting requiring annual math and reading testing in grades 3-8 and once in high school. That support drops to 46 percent among teachers—and 34 percent among public school teachers who are union members.
- School safety is a big deal: 43 percent of respondents are not so or not at all confident that there is sufficient security against a shooting attack in their local public schools; only 16 percent said they are extremely or very confident.
- While it’s not in our wheelhouse, it’s worth noting that 69 percent of respondents think a two-year college education should be free, and 60 percent believe a four-year college education should be free.
- Finally, 82 percent of respondents reported never or almost never participating in political activities to support a candidate or issue, and only 36 percent were sure they voted in the last school board election.
If you’ve got the time, you should definitely check out the entire poll—and the great interactive format EdNext uses to present its data.
Our next Schooling in America survey will publish in October, and we’ll take a look then to see how our results stack up with the results from this poll.


