Schooling in America Series: Getting to Know School Parents
Parents tend to be satisfied with their local public schools but want more options for their children at the same time. That may seem like a contradiction, but years of our annual survey and participation in school choice programs help back this up.
That’s one trend that seems consistent, but parents aren’t a predictable bunch. They choose different types of schools for different reasons, and—despite a relatively healthier economy—have been doing and likely spending more to support their children’s education than a few years ago.


We’re exploring topics like school choice and K–12 funding in this series, as well as some exciting new topics as well. We’ll incorporate others’ polling work and current events to add context to our survey.
For today, though, let’s delve into parents’ schooling experiences and preferences.
What Do Parents Think About Their Kids’ Schools?
Current school parents are much more likely to rate their local private schools highly (75% “A” or “B” rating) compared to public district schools (52%). Both public charters and district schools’ grades were more evenly distributed than those of local private schools.
Public schools also earned a variety of letter grades in Education Next’s annual poll: Parents mostly gave the public schools in their community “B”s (38%) and “C”s (30%), although they were slightly more generous in their “A” ratings than the general public (18% vs. 13%).
PDK, in its 2018 poll, saw on overwhelming majority of public school parents rate their child’s school highly (70% “A” or “B”). It is important to distinguish this finding from ours, though. While the Schooling in America grades of local schools includes parents’ grading of their own child’s school, it also includes parents’ assessment of other schools in their communities. As PDK points out, parents tend to rate their child’s own schools higher than schools in their community as well as nationally.
Though parents were more likely to grade their local private schools higher than public district schools, parents with children in both schooling sectors were less satisfied in these sectors than last year. Interestingly, we saw decreases in satisfaction across three out of four schooling sectors, with only charter school parents showing increased satisfaction since last year (78% satisfied, compared to 75% in 2017). Home school satisfaction dropped to 86 percent; private school to 79 percent; and public school to 66 percent.
Gallup, which has been using this type of question since 1999, reported 71 percent of parents were satisfied with their children’s schools, a result that is below their historical average of 76 percent. Gallup’s parent satisfaction result this year was slightly higher than the public school satisfaction rate we detected. Because an overwhelming majority of parents in our sample have experienced public schools compared to other schooling sectors, our public school satisfaction rate may be somewhat comparable to Gallup’s, which did not differentiate responses by school sector.
The 2018 PDK Poll also observed declining school satisfaction, using an interesting question. More than half of adults (55%) said current students are receiving a worse education now than when they were students, which is the most negative result in the six times PDK has asked this question since the 1970s.
Where Would Parents Prefer to Send Their Kids to School?
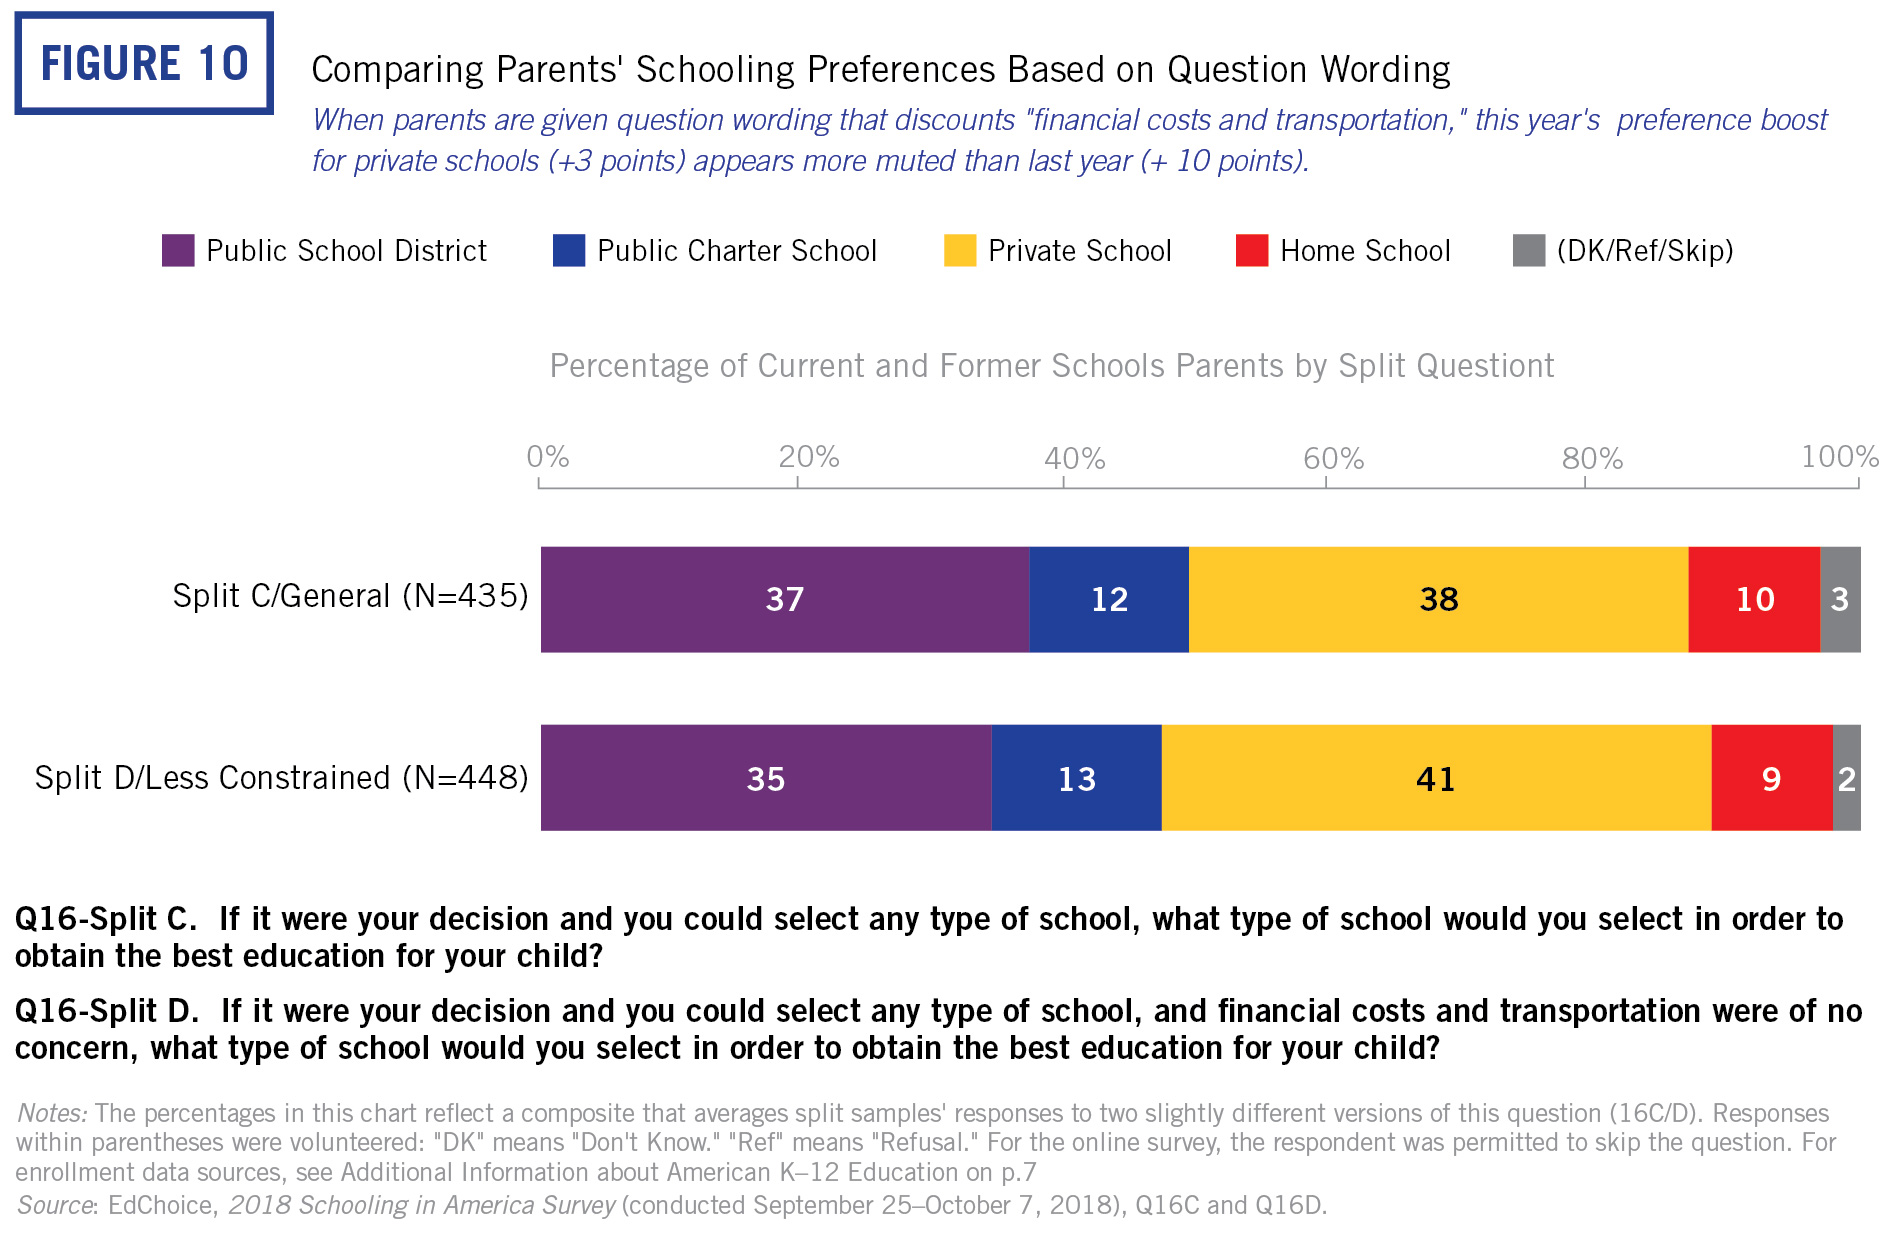
Like satisfaction levels for public charter and private schools, the proportion of parents who prefer those type of schools has also slightly dropped. That said, parents’ schooling preferences remain a pluralistic portrait of the country’s education landscape. Similar proportions of parents would prefer a public school (36%) to a private school (40%), and nearly the same prefer charter schools (13%) to homeschooling (10%).

That stands in contrast with the types of schools children have actually attended, according to parent respondents in our survey. Less than one-fifth (17%) have experienced private schools, and even fewer have attended charter schools (13%) or been homeschooled (10%). Another way to measure this contrast is by current enrollment patterns reflecting a snapshot in time. The latest-available data from the National Center for Education Statistics show more than four-fifths of students (82%) are currently enrolled in traditional public schools, followed by 10 percent in private schools, 5 percent in charter schools and 3 percent in home schools.
Why Do Parents Choose the Schools They Choose?
Parents choose different school types for different reasons. Individual children and families have different needs, and parents may look to different schooling sectors to fulfill those needs.

Roughly one-fourth of parents who prefer homeschooling prioritize safety (26%) more than any other reason for choosing a school. While school safety didn’t rank in the Top 5 for the other school sectors, it has clearly become a national concern.
Young, first-time voters ranked safety related to school shootings as the most important problem facing the country today in an Education Week Research Center survey, and Pew relayed a government report showing a rising share of public elementary schools employing law enforcement officials on site. The number of schools with sworn officers on site has also risen dramatically in the past decade.
And in our survey, parents ranked school safety (38%) as the top thing an education accountability system should evaluate, which was a slightly higher rate than both teachers (35%) and the general population (36%). Parents also ranked being accountable for school safety higher than things like student achievement (29%), attainment (24%) and social/emotional learning (19%) in our accountability question.
Speaking of the general population, tomorrow we’ll be digging deeper into the public’s view of American public education.
Other Posts in the Schooling in America Series
Schooling in America Series: Getting to Know Our Teachers
Schooling in America Series: Getting to Know the Public on Public Education


