Key Findings
- More than half of Pennsylvanians (51%) said they had never heard of tax-credit scholarships. When provided with a definition of the Educational Improvement Tax Credit Program (EITC), nearly three-fourths of Pennsylvanians (71%) are in favor of the state’s largest tax-credit scholarship program.
- Residents of the City of Philadelphia (79%) were the observed demographic group most likely to favor the EITC, while residents of Allegheny County (64%) were the least likely to favor the program.
- When provided a definition of the Opportunity Scholarship Tax Credit Program (OSTC), nearly three-fourths of Pennsylvanians (71%) are in favor of the state’s tax-credit scholarship program for students living in a “low-achieving” school zone.
- Residents of the City of Philadelphia (79%) were the observed demographic group most likely to favor the OSTC, while high-income earners (64%) were the least likely to favor the program.
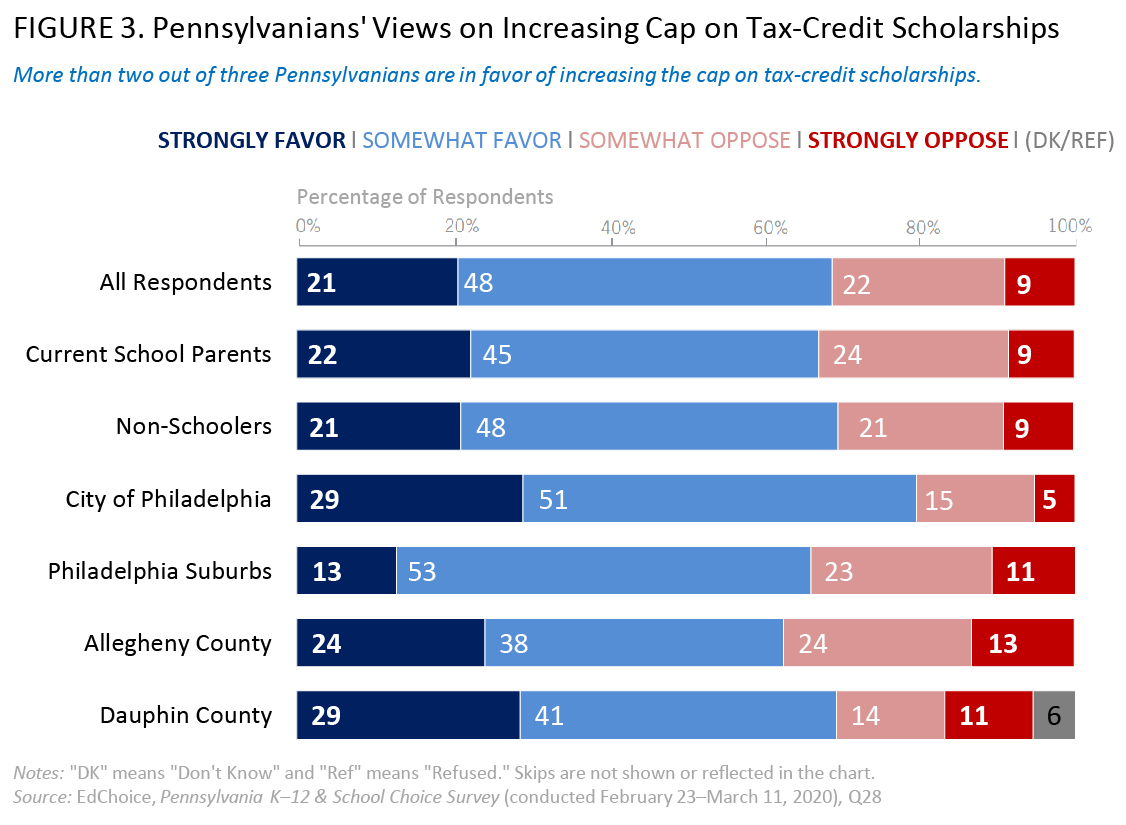
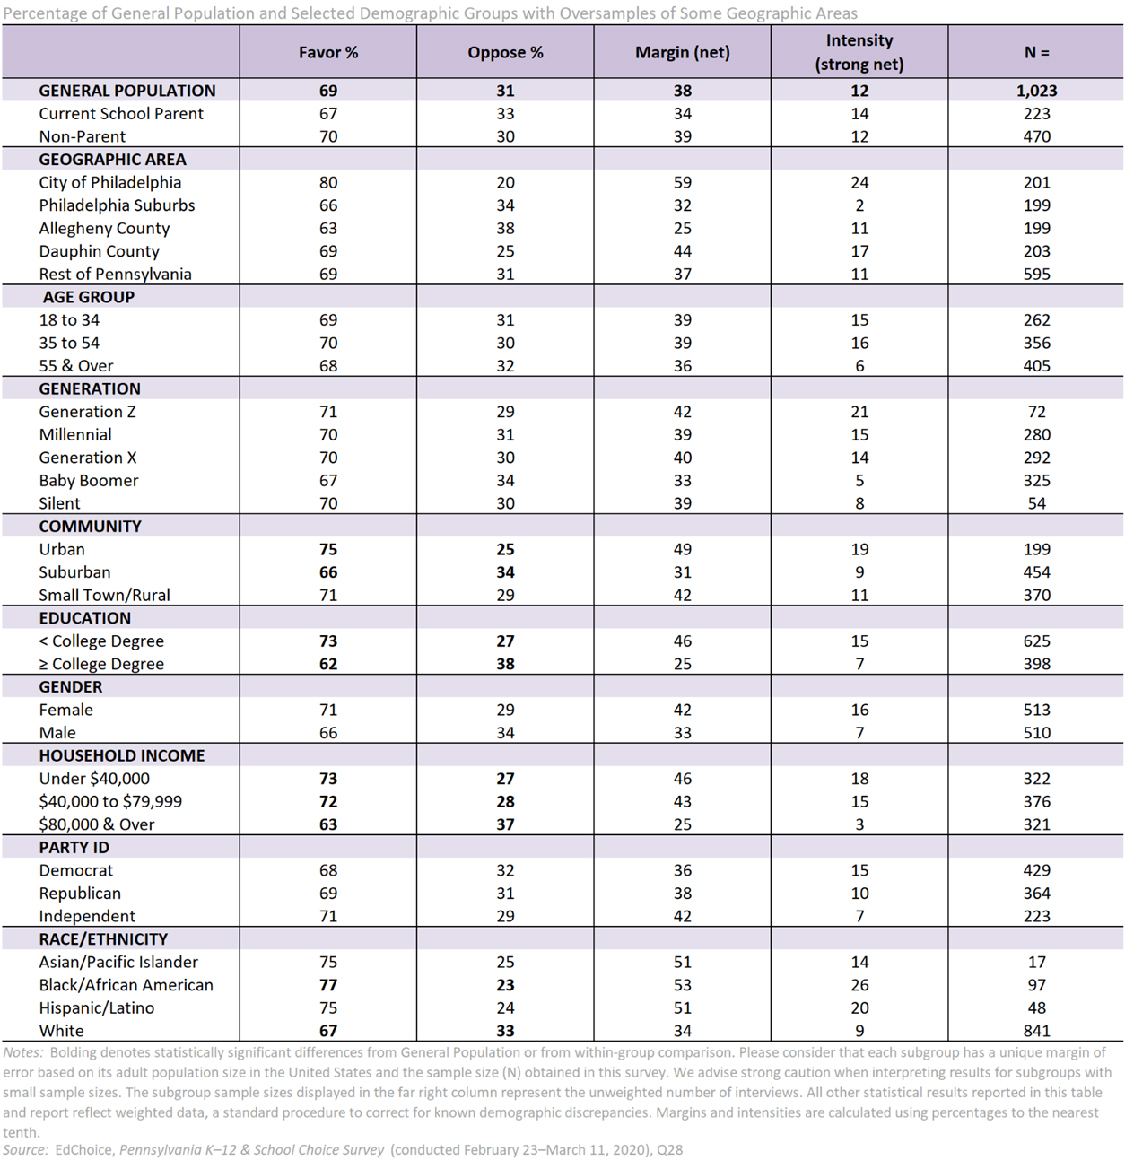
- When asked their views on increasing the cap on tax-credit scholarships, more than two-thirds of Pennsylvanians (69%) were in favor. Residents of the City of Philadelphia (80%) were most likely to favor increasing the cap and college graduates (62%) were least likely to favor increasing the cap on tax-credit scholarships.
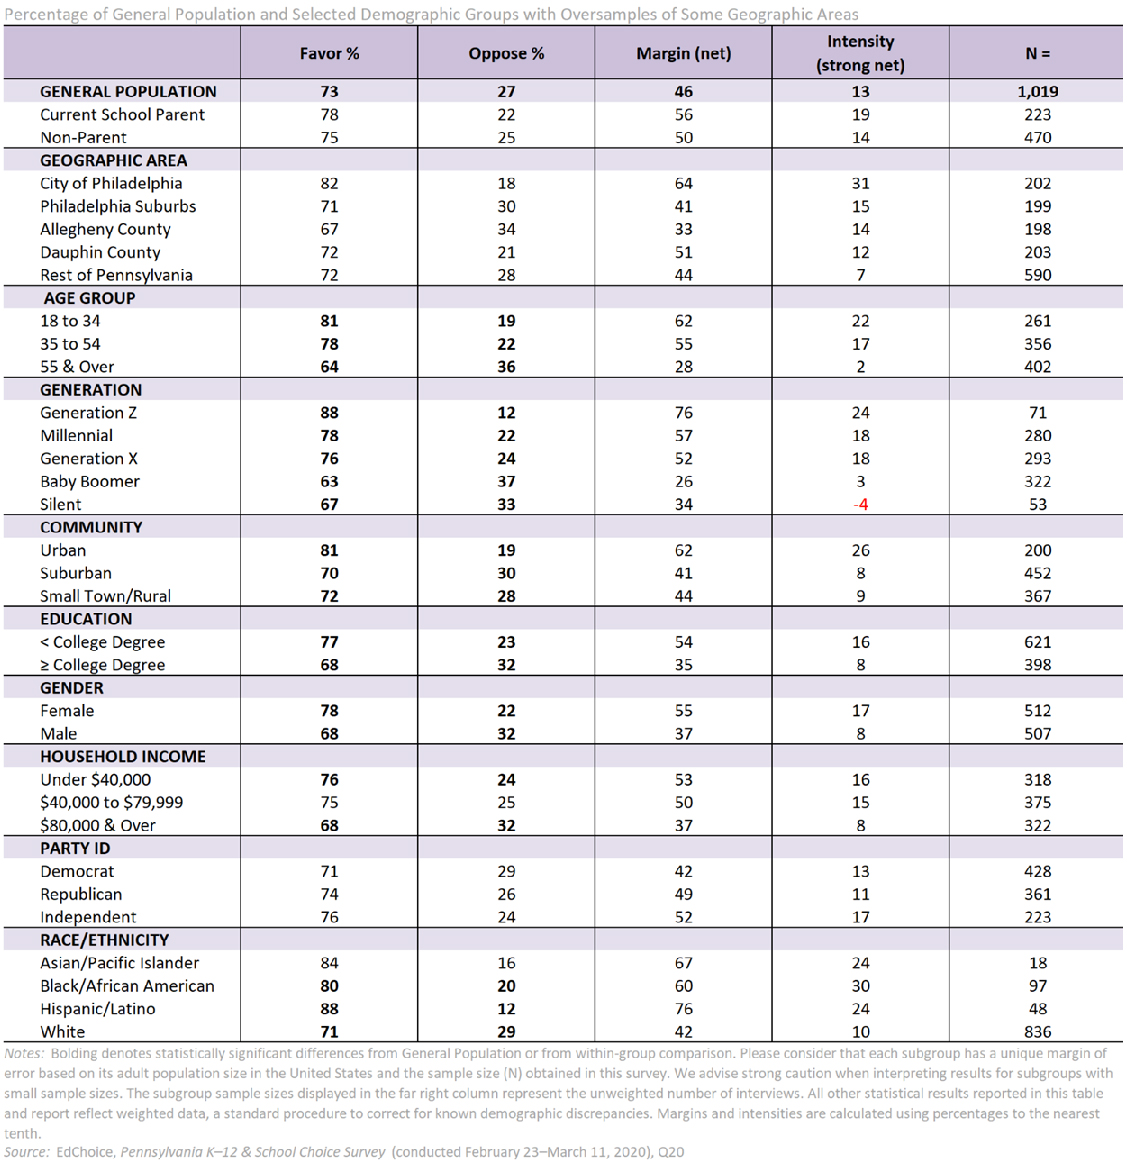
- More than two-fifths of Pennsylvanians (42%) said they had never heard of Education Scholarship Accounts (ESAs). However, after being provided with a definition, 73 percent of Pennsylvanians are in favor of ESAs.
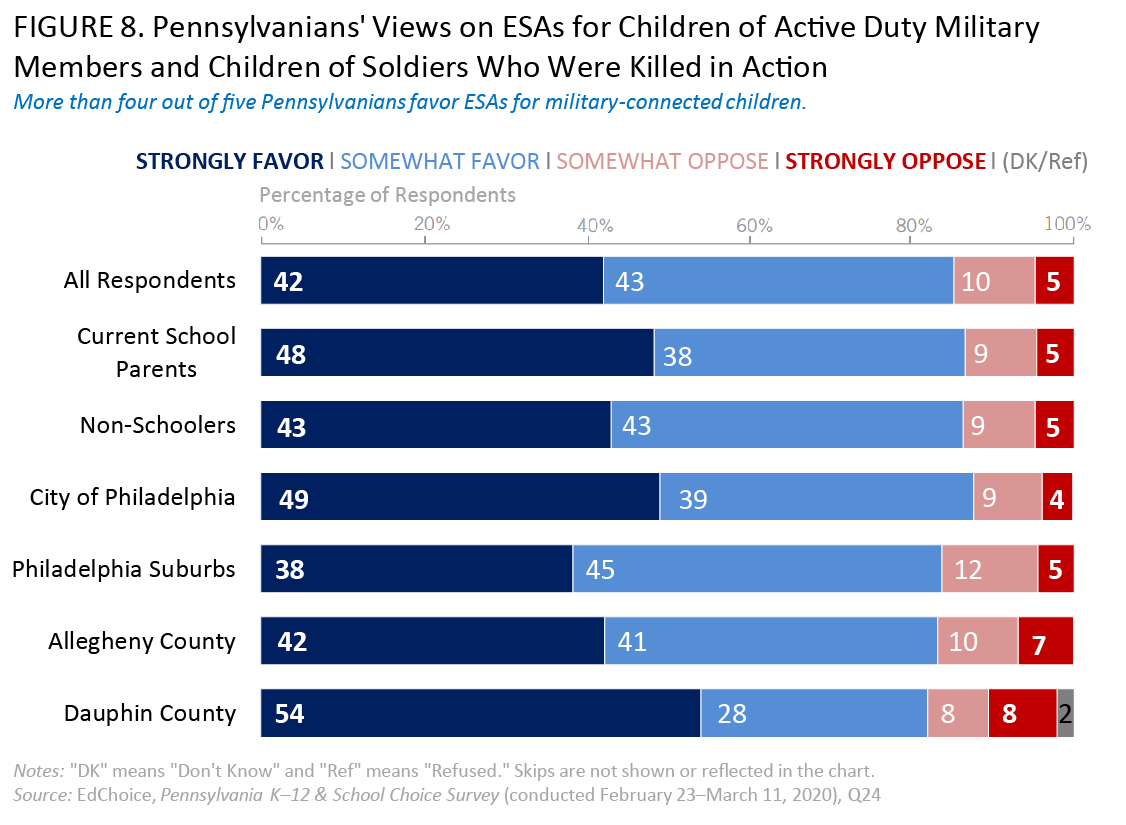
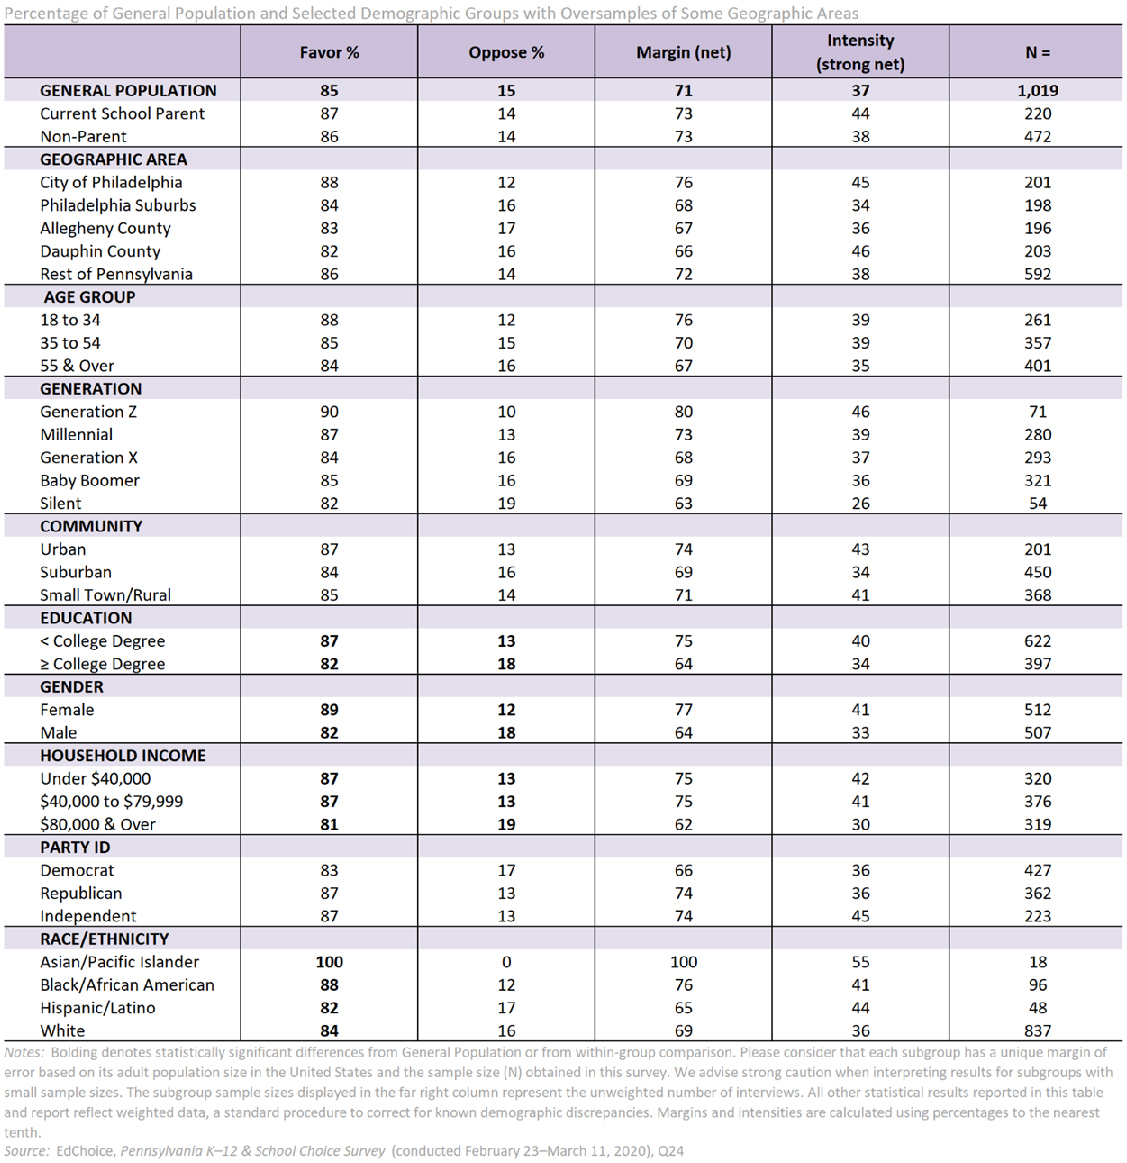
- When asked their views on an ESA program for children of active duty military members and children of soldiers who were killed in action, more than four-fifths of Pennsylvanians (85%) are in favor. More than two out of five “strongly favor” such an ESA program.
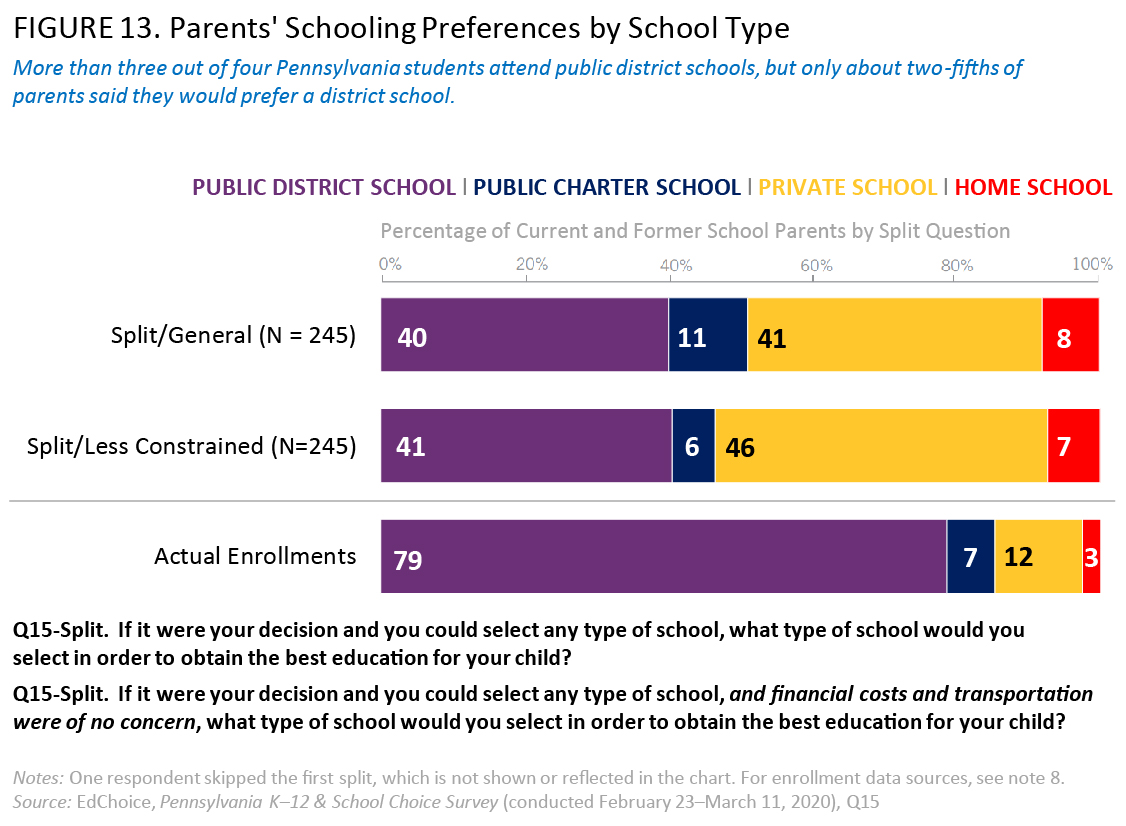
- More than two out of five Pennsylvania parents (44%) said they would prefer to send their children to private school, whereas only 12 percent of Pennsylvania K–12 students are enrolled in a private school. Seventy-nine percent of Pennsylvania’s K–12 students attend a public district school; 40 percent of parents said they would select this type of school for their child if given other options.
- In a split-sample experiment, 46 percent of Pennsylvania current and former school parents said that if financial cost and transportation were of no concern, they would select private schooling to obtain the best education for their child.
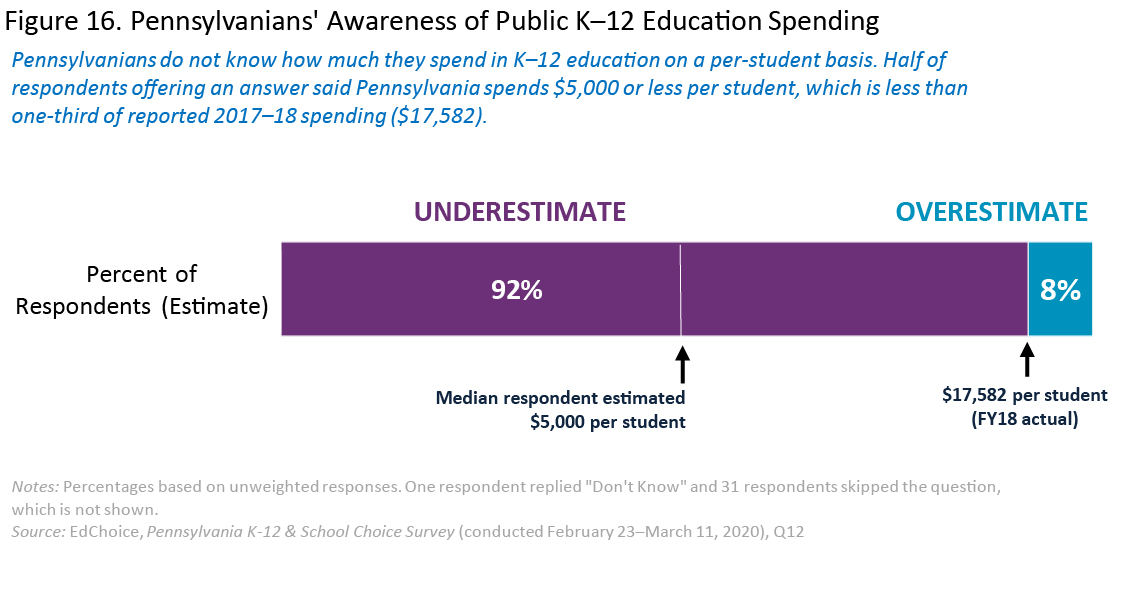
- Pennsylvanians severely underestimate how much is spent per student in public schools. Half of respondents offering an answer said Pennsylvania spends $5,000 or less per student, which is less than one-third of reported 2017–18 spending ($17,582).1 In total, 92 percent of respondents underestimated per-pupil public spending.
Overview
Pennsylvania awards the third-most tax-credit scholarships in the nation, behind Arizona and Florida. One of the state’s two scholarship programs for students from low- to middle-income families is specifically for those who are zoned to attend a low-achieving school.
Pennsylvania’s Educational Improvement Tax Credit Program (EITC) began in 2001 and is open to students from low- to middle-income families. In 2017–18, there were 37,725 scholarships awarded to students to attend private schools, with the average amount being $1,816. Pennsylvania’s Opportunity Scholarship Tax Credit (OSTC) program began in 2012 and is open to students from low- to middle-income families living in a “low-achieving” school zone, with low-achieving defined as the state’s bottom 15 percent of public schools based on standardized tests. In 2017–18, there were 14,419 scholarships awarded to students to attend private schools, with the average amount being $2,490. In total, there were more than 52,000 tax-credit scholarships awarded to Pennsylvania students in 2017-18.2
The purpose of the Pennsylvania K–12 & School Choice Survey is to measure public opinion on, and in some cases awareness or knowledge of, a range of K–12 education topics and school choice reforms. EdChoice and the Commonwealth Foundation developed this project in partnership with Braun Research, Inc., which conducted the online interviews and live phone call interviews, collected the survey data, and provided data quality control.
We explore the following topics and questions:
- In which direction do Pennsylvanians think K–12 education in the state is heading?
- Do they believe district schools are adequately funded?
- How would they rate the various types of schooling options in the state in general and in their area specifically?
- What sort of schooling options would they prefer for their own children?
- How supportive are Pennsylvanians of the various types of educational choice programs?
- And what are their views on Pennsylvania’s current educational choice programs?
Methods and Data
The Pennsylvania K–12 & School Choice Survey project, funded and developed by EdChoice in partnership with the Commonwealth Foundation and conducted by Braun Research, Inc., interviewed a statistically representative statewide sample of Pennsylvania voters (age 18+). Data collection methods consisted of a non-probability-based opt-in online panel and probability sampling and random-digit dial for telephone. The unweighted statewide sample includes a total of 1,270 online interviews and 137 live phone interviews completed in English from February 23–March 11, 2020. The margin of sampling error for the total statewide sample is ±2.61 percentage points.
The statewide sample was weighted using population parameters from the U.S. Census Bureau’s 2010 Decennial Census for voters living in the state of Pennsylvania. Results were weighted on age, county, race, ethnicity, community type, income, gender, and party ID. Weighting based on income used data from the U.S. Census Bureau’s 2018 American Community Survey 5-Year Estimates. Results were also weighted based on party affiliation data obtained from the Pennsylvania Department of State, state records as of March 9, 2020.
Ground Rules
Before discussing the survey results, we want to provide some brief ground rules for reporting statewide sample and demographic subgroup responses in this brief. For each survey topic, there is a sequence for describing various analytical frames. We note the raw response levels for the statewide sample on a given question. Then we consider the statewide sample’s margin, noting differences between positive and negative responses. If we detect statistical significance on a given item, then we briefly report demographic results and differences. We do not infer causality with any of the observations in this brief. Aside from the demographic tables in the appendices, we do not use specific subgroup findings if there were fewer than 70 respondents.
Explicit subgroup comparisons/differences are statistically significant with 95 percent confidence, unless otherwise clarified in the narrative. We orient any listing of subgroups’ margins around more/less “likely” to respond one way or the other, usually emphasizing the propensity to be more/less positive. Subgroup comparisons are meant to be suggestive for further exploration and research beyond this project.
Findings
Tax-Credit Scholarships
Tax-credit scholarships allow taxpayers to receive full or partial tax credits when they donate to nonprofits that provide private school scholarships. Eligible taxpayers can include both individuals and businesses. In some states, scholarship-giving nonprofits also provide innovation grants to public schools and/or transportation assistance to students who choose alternative public schools. As of January 2020, there are 23 tax-credit scholarship programs in 18 states with nearly 300,000 scholarships awarded in the most recent school year.3
Of the current school parents who responded to the survey, 57 percent had never heard of Pennsylvania’s tax-credit scholarship programs and 31 percent had heard of the programs but did not apply.
Educational Improvement Tax Credit Program (EITC)
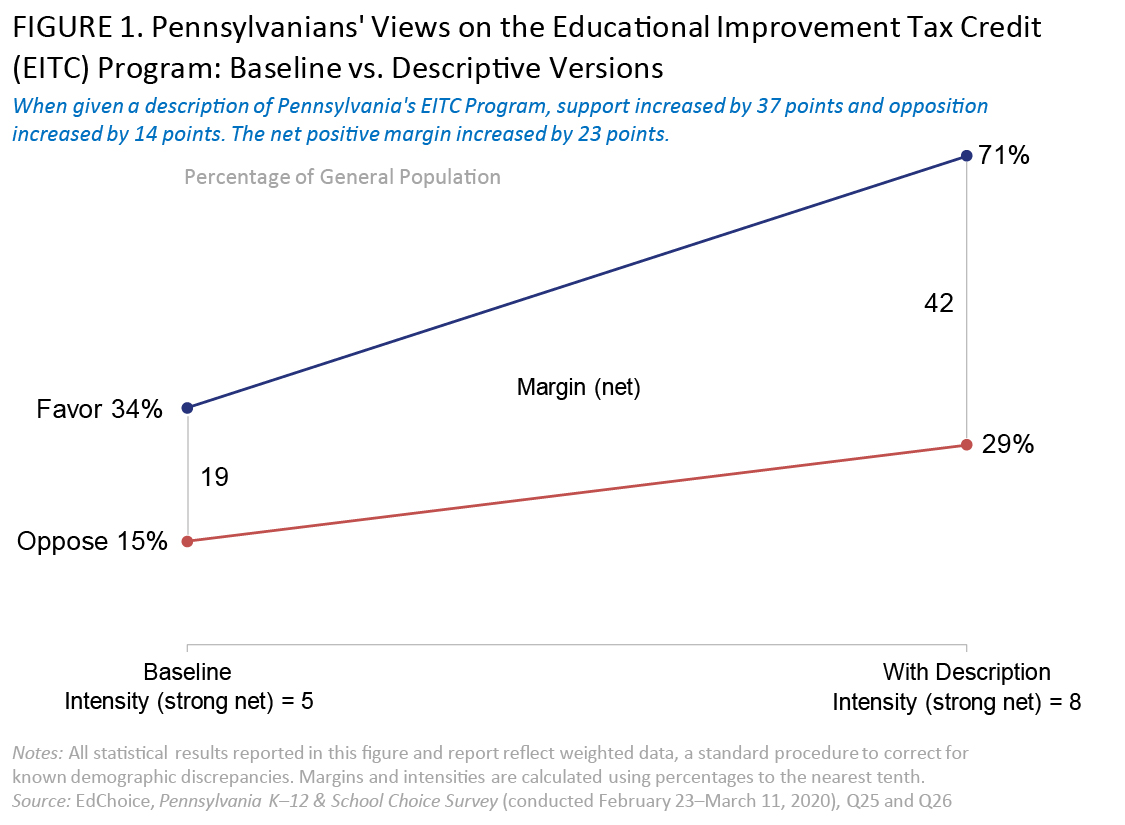
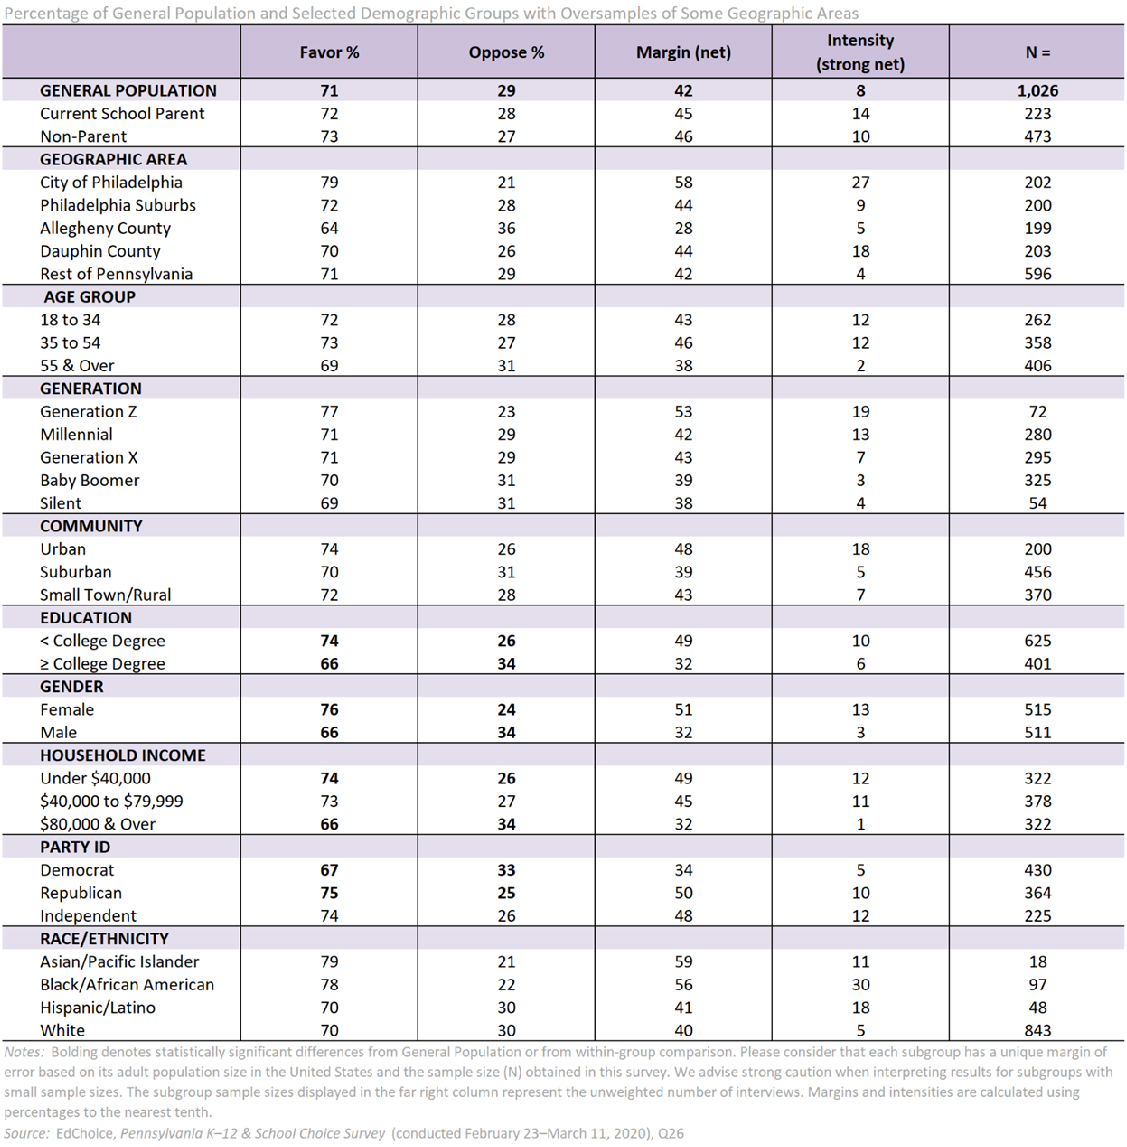
Pennsylvanians are more than twice as likely to favor the Educational Improvement Tax Credit Program (EITC), the state’s original tax-credit scholarship program, than they are to oppose it. More than two-thirds of respondents (71%) said they supported the EITC program after being given a description, whereas 29 percent said they oppose. The margin is +42 percentage points. Pennsylvanians are more likely to express an intensely positive response compared with a negative response (18% “strongly favor” vs. 10% “strongly oppose”).
An initial question asked for an opinion of tax-credit scholarships without offering any description. On this baseline question, 34 percent of respondents said they favored tax-credit scholarships, and 15 percent said they opposed them. In the follow-up question, respondents were given a description of the EITC program. With this information, support increased 37 points to 71 percent, and opposition increased 14 points to 29 percent.
More than half of Pennsylvanians (51%) said they had never heard of tax-credit scholarships on the baseline item. The subgroups having the highest proportions saying they had never heard of tax-credit scholarships are: Generation Z (55%), Democrats (55%), residents of Philadelphia suburbs (55%), and females (58%).4
The margins of all subgroups observed are positive—and they all exceed +28 percentage points. The largest positive margins for the EITC program are among: residents of the City of Philadelphia (+58 points), African Americans (+56 points), Generation Z (+53 points), females (+51 points), and Republicans (+50 points). The subgroups exhibiting the lowest net positive margins for EITC program favorability include residents of Allegheny County (+28 points), males (+32 points), college graduates (+32 points), and high-income earners (+32 points).
In addition:
- Females (76%) were more likely to favor the EITC program than males (66%).
- Low-income earners (74%) were more likely to favor the EITC program than high-income earners (66%).
- Those without a college degree (74%) were more likely to favor the EITC program than college graduates (66%).
Opportunity Scholarship Tax Credit (OSTC) Program
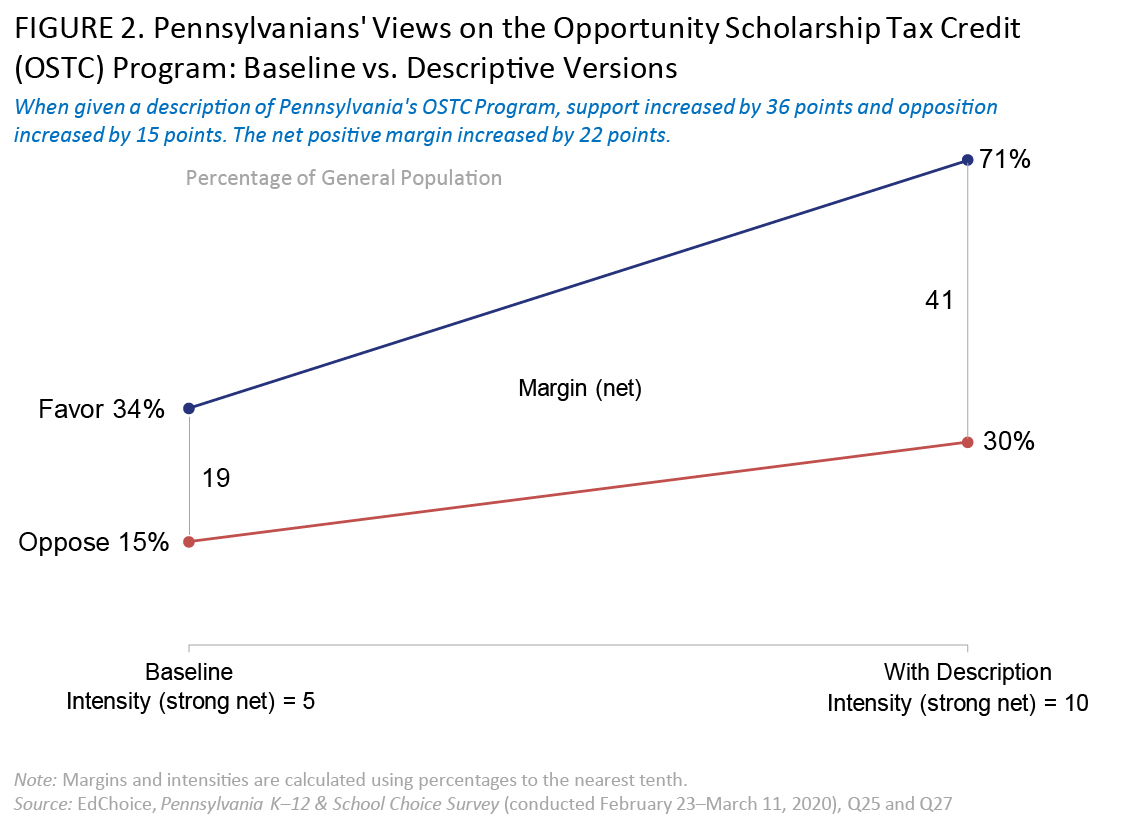
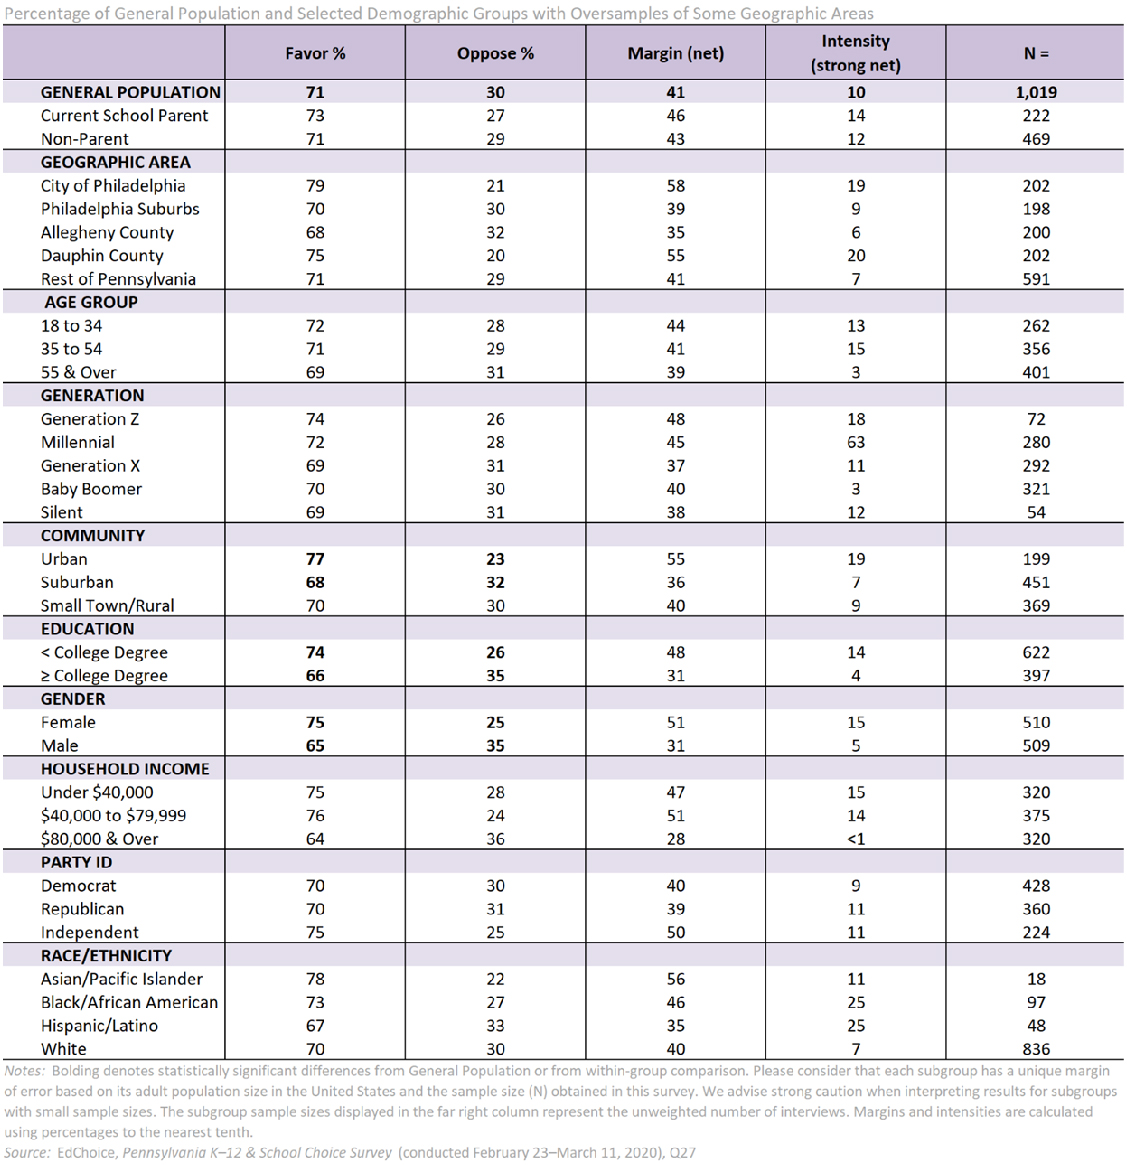
Pennsylvanians are much more likely to favor the Opportunity Scholarship Tax Credit Program (OSTC) than they are to oppose it. More than two-thirds of respondents (71%) said they supported Pennsylvania’s tax-credit scholarship program for students living in a “low-achieving” school zone, whereas 30 percent said they oppose. The margin is +41 percentage points. Pennsylvanians are more likely to express an intensely positive response compared with a negative response (19% “strongly favor” vs. 9% “strongly oppose”).
An initial question asked for an opinion of tax-credit scholarships without offering any description. On this baseline question, 34 percent of respondents said they favored tax-credit scholarships, and 15 percent said they opposed them. In the follow-up question, respondents were given a description of the OSTC program. With this information, support increased 36 points to 71 percent, and opposition increased 15 points to 30 percent.
The margins of all subgroups observed are positive—and they all exceed +28 percentage points. The largest positive margins for the OSTC program are among: residents of the City of Philadelphia (+58 points), residents of Dauphin County (+55 points), urbanites (+55 points), middle-income earners (+51 points), and females (+51 points). The subgroups exhibiting the lowest net positive margins for OSTC program favorability include high-income earners (+28 points), males (+31 points), and residents of Allegheny County (+35 points).
In addition:
- Females (75%) were more likely to favor the OSTC program than males (65%).
- Urbanites (77%) were more likely to favor the OSTC program than suburbanites (68%).
- Middle-income earners (76%) and low-income earners (72%) were more likely to favor Opportunity Scholarships than high-income earners (64%).
- Those without a college degree (74%) were more likely to favor the OSTC program than college graduates (66%).
Tax-Credit Scholarship Cap Increase
Currently, there is a limit on the number of tax-credit scholarships available to Pennsylvania students. As a result, many children are currently on waiting lists to receive scholarships or have been denied to due to the cap.5 Pennsylvanians are much more likely to favor increasing the cap on these tax-credit scholarships so more children can participate in the programs than they are to oppose it. More than two-thirds of respondents (69%) said they supported increasing the cap on Pennsylvania’s tax-credit scholarship programs, whereas 31 percent said they oppose. The margin is +38 percentage points. Pennsylvanians are more likely to express an intensely positive response compared with a negative response (21% “strongly favor” vs. 9% “strongly oppose”).
The margins of all subgroups observed are positive—and they all exceed +25 percentage points. The largest positive margins for increasing the cap on tax-credit scholarships are among: residents of the City of Philadelphia (+59 points), African Americans (+53 points), urbanites (+49 points), those without a college degree (+46 points), and low-income earners (+46 points). The subgroups exhibiting the lowest net positive margins for favorability of increasing the cap on tax-credit scholarships include college graduates (+25 points), residents of Allegheny County (+25 points), high-income earners (+25 points), and suburbanites (+31 points).
In addition:
- Urbanites (75%) were more likely to favor increasing the cap on tax-credit scholarships than suburbanites (66%).
- Low-income earners (73%) and middle-income earners (72%) were more likely to favor increasing the cap on tax-credit scholarships than high-income earners (63%).
- Those without a college degree (73%) were more likely to favor increasing the cap on tax-credit scholarships than college graduates (62%).
- African American Pennsylvanians (77%) were more likely to favor increasing the cap on tax-credit scholarships than white Pennsylvanians (67%).
Education Scholarship Accounts (ESAs)
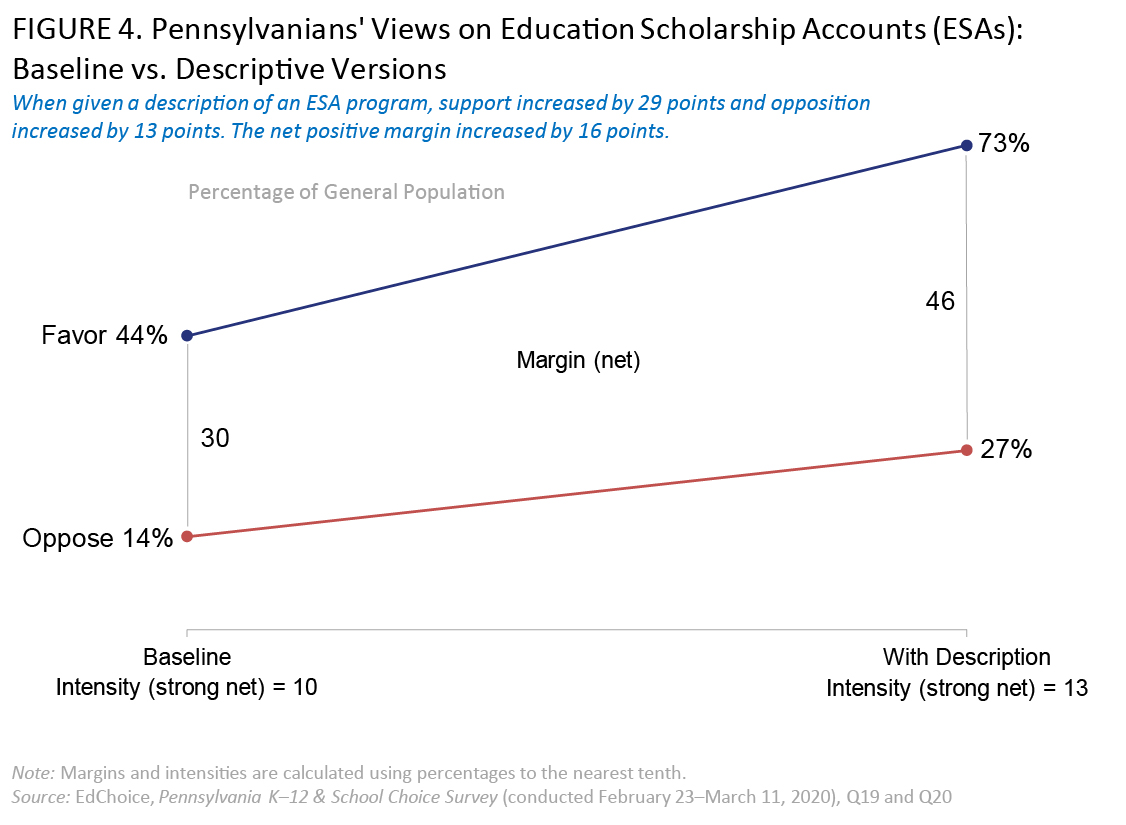
Education Scholarship Accounts (ESAs) are currently active in five states and have been introduced in dozens more. ESAs allow parents to customize their child’s education. With ESAs, a portion of the state’s per-pupil education funding would be placed in a restricted-use account that parents control. The money could be used for things like private school tuition, online classes, curriculum, tutoring, and services for students with special needs.6 Pennsylvanians are nearly three times as likely to support ESAs as they are to oppose them. Almost three-fourths of respondents (73%) said they supported ESAs, whereas 27 percent said they oppose. The margin is +46 percentage points. Pennsylvanians are more likely to express an intensely positive response compared with a negative response (21% “strongly favor” vs. 8% “strongly oppose”).
An initial ESA question asked for an opinion without offering any description. On this baseline question, 44 percent of respondents said they favored an ESA system, and 14 percent said they opposed. In the next question, respondents were given a description of a general ESA program. With this program-specific information, support increased 29 points to 73 percent, and opposition increased 13 points to 27 percent.
More than two out of five Pennsylvanians (42%) said they had never heard of ESAs on the baseline item. The subgroups having the highest proportions saying they had never heard of ESAs are: seniors (50%), Baby Boomers (49%), Independents (47%), high-income earners (46%), college graduates (46%), residents of Philadelphia suburbs (45%).
The margins of all subgroups observed are positive—and they exceed +26 percentage points for all subgroups. The largest positive margins are among Generation Z (+76 points), residents of the City of Philadelphia (+64 points), urbanites (+62 points), younger Pennsylvanians (+62 points), and African Americans (+60 points). The subgroups exhibiting the lowest net positive margins for ESA favorability include Baby Boomers (+26 points), seniors (+28 points), and residents of Allegheny County (+33 points).
In addition:
- Younger Pennsylvanians (81%) and middle-age Pennsylvanians (78%) were more likely to favor ESAs than senior Pennsylvanians (64%).
- Generation Z (88%) were more likely than Millennials (78%) and Generation Xers (76%) to favor ESAs and all three generations were more likely to favor ESAs than Baby Boomers (63%).
- Urbanites (81%) were more likely to favor ESAs than small town and rural residents (72%) and suburbanites (70%).
- Females (78%) were more likely to favor ESAs than males (68%).
- Low-income earners (76%) were more likely to favor ESAs than high-income earners (68%).
- Those without a college degree (77%) were more likely to favor ESAs than college graduates (68%).
- African American Pennsylvanians (80%) were more likely to favor ESAs than white Pennsylvanians (71%).
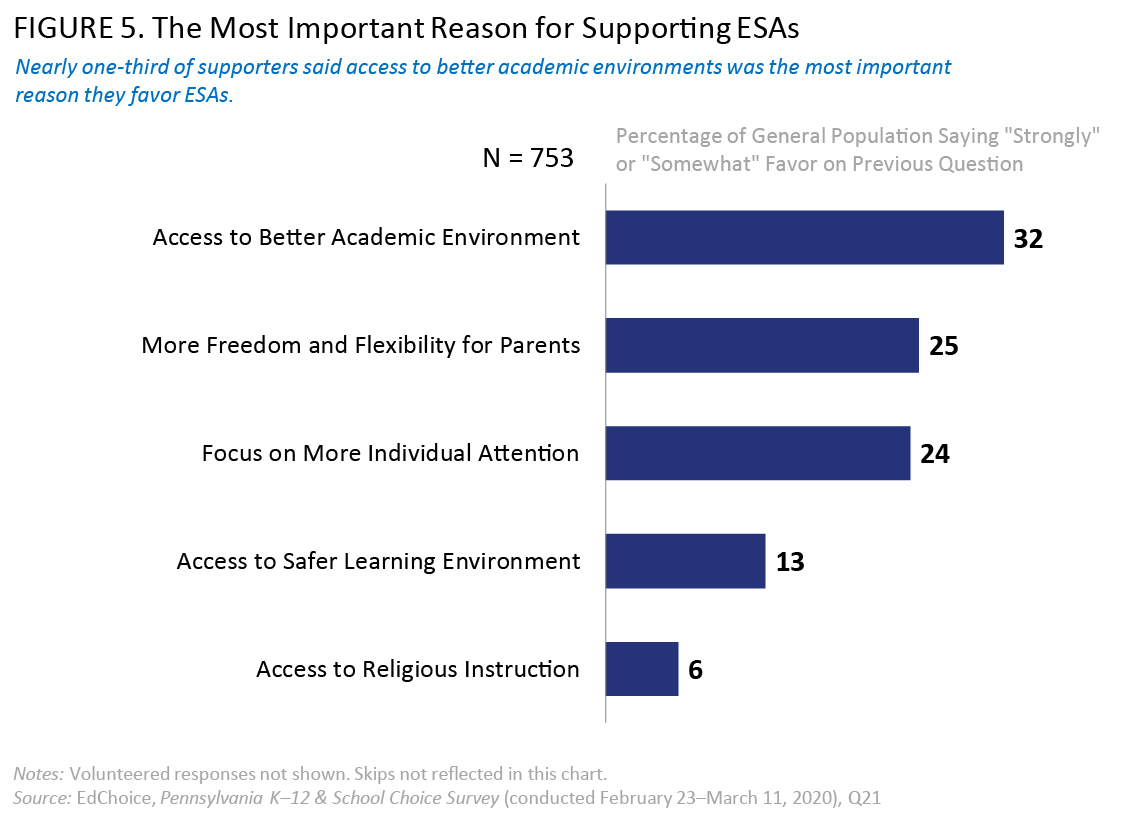
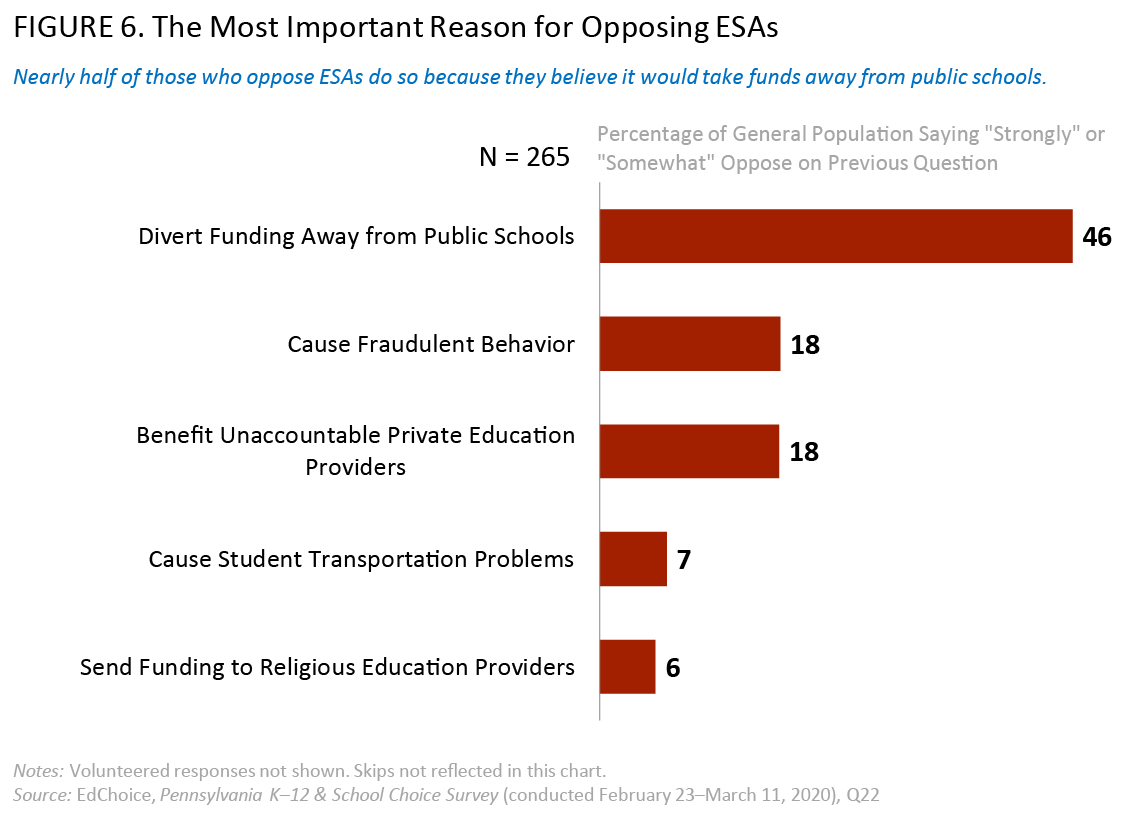
In a follow-up item, we learned the most common reasons for supporting ESAs are: “access to better academic environment” (32%), “more freedom and flexibility for parents” (25%), and “focus on more individual attention” (24%). Respondents opposed to ESAs answered a similar follow-up question. By far the most common reason for opposing this policy is the belief it would “divert funding away from public schools” (46%).
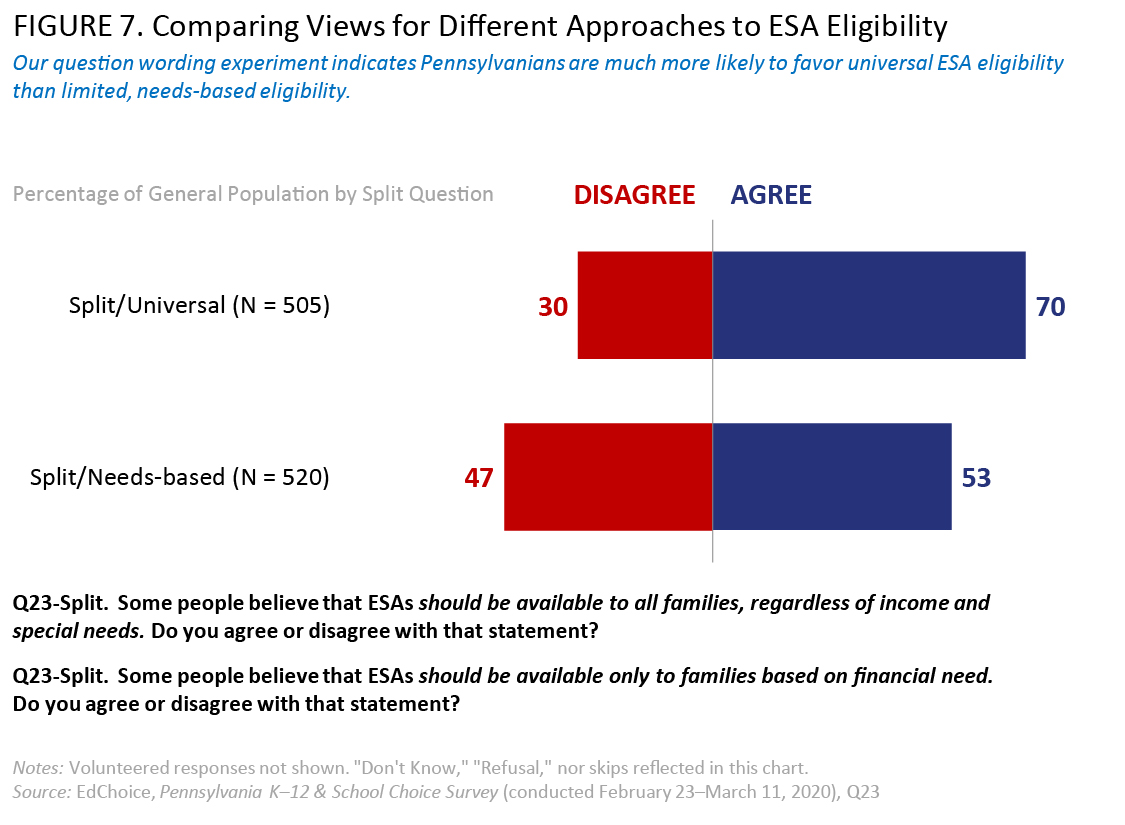
A subsequent split-sample experiment shows Pennsylvanians are inclined toward universal eligibility for ESAs rather than means-tested eligibility based solely on financial need. In the universal split, 70 percent of respondents said they agree with the statement that “ESAs should be available to all families, regardless of income and special needs.” About 28 percent “strongly agree” with that statement. Nearly one-third of Pennsylvanians (30%) disagree with that statement; 11 percent said they “strongly disagree.” In the comparison sample, needs-based split, respondents were asked if they agree with the statement, “ESAs should only be available to families based on financial need.” Fifty-three percent agreed with that statement, while 12 percent said “strongly agree.” Nearly half of Pennsylvanians (47%) said they disagree with means-testing ESAs, and 17 percent said they “strongly disagree.” Three out of four current school parents (75%) agree that educational choice programs like ESAs should be available to all families, with nearly one-third (31%) saying they “strongly agree.”
Pennsylvanians are more than five times as likely to support ESAs for military-connected children than they are to oppose them. More than four-fifths of respondents (85%) said they supported ESAs for children of active duty military members and children of soldiers who were killed in action (KIA), whereas 15 percent said they oppose. The margin is +70 percentage points. Pennsylvanians are more likely to express an intensely positive response compared with a negative response (42% “strongly favor” vs. 5% “strongly oppose”).
The margins of all subgroups observed are positive—and they exceed +62 percentage points for all subgroups. The largest positive margins are among Generation Z (+80 points), females (+77 points), younger Pennsylvanians (+76 points), African Americans (+76 points), residents of the City of Philadelphia (+76 points), those without a college degree (+75 points), low-income earners (+75 points), and middle-income earners (+75 points). The subgroups exhibiting the lowest net positive margins for military-connected ESA favorability include high-income earners (+62 points), males (+64 points), and college graduates (+64 points).
In addition:
- Females (89%) were more likely to favor ESAs for military-connected children than males (82%).
- Low-income earners (87%) and middle-income earners (87%) were more likely to favor ESAs for military-connected children than high-income earners (81%).
- Those without a college degree (87%) were more likely to favor ESAs for military-connected children than college graduates (82%)
Public Charter Schools
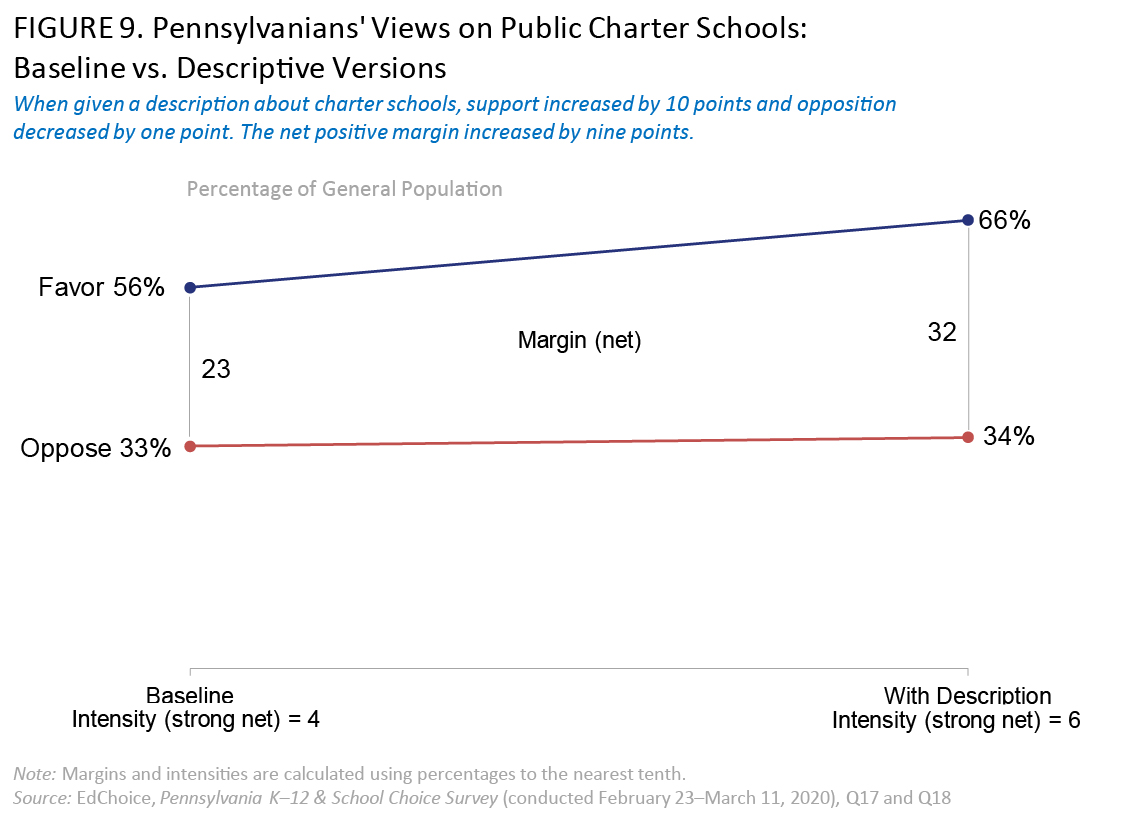
Pennsylvania enacted its charter school law in 1997 and public charter schools in the state may not be operated by for-profit entities.7 Respondents were asked two questions about charter schools, and Pennsylvanians clearly support them, both before and after given a description.
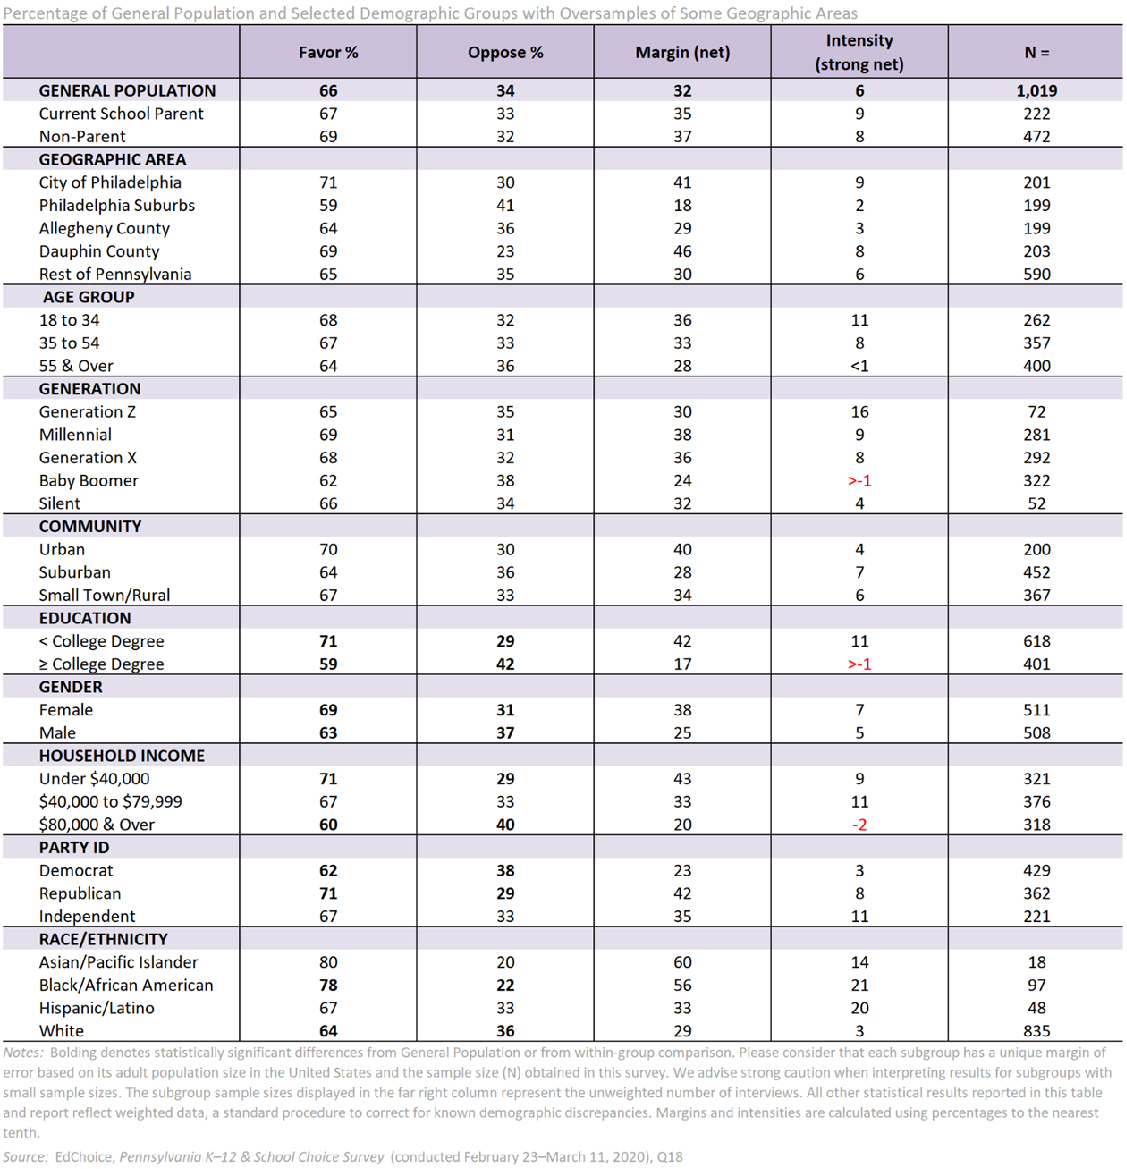
Interviewers first asked for an opinion without offering any description. On this baseline question, 56 percent of respondents said they favored charters, and 33 percent said they opposed them. In the follow-up question, respondents were given a general description of a charter school. With that information, support increased 10 points to 66 percent, and opposition increased one point to 34 percent. The margin of support was large (+32 points).
Slightly more than one in 10 Pennsylvanians (11%) said they had never heard of charter schools on the baseline item. The subgroups having the highest proportions saying they had never heard of charter schools are Generation Z (20%), younger Pennsylvanians (18%), Republicans (16%), Millennials (15%), small town and rural residents (14%), and those without a college degree (14%).
The margins of all subgroups observed are positive—and they exceed +17 percentage points for all subgroups. The largest positive margins are among African Americans (+56 points), Dauphin County residents (+46 points), low-income earners (+43 points), Republicans (+42 points), and those without a college degree (+42 points). The subgroups exhibiting the lowest net positive margins for charter school favorability include college graduates (+17 points), residents of Philadelphia Suburbs (+18 points), high-income earners (+20 points), and Democrats (+23 points).
In addition:
- Republicans (71%) were more likely to favor charter schools than Democrats (62%).
- Females (69%) were more likely to favor charter schools than males (63%).
- Low-income earners (71%) were more likely to favor charter schools than high-income earners (60%).
- Those without a college degree (71%) were more likely to favor charter schools than college graduates (59%) and the total statewide sample (66%).
- African American Pennsylvanians (78%) were more likely to favor charter schools than white Pennsylvanians (67%) and the total statewide sample.
School Type Enrollments and Satisfaction
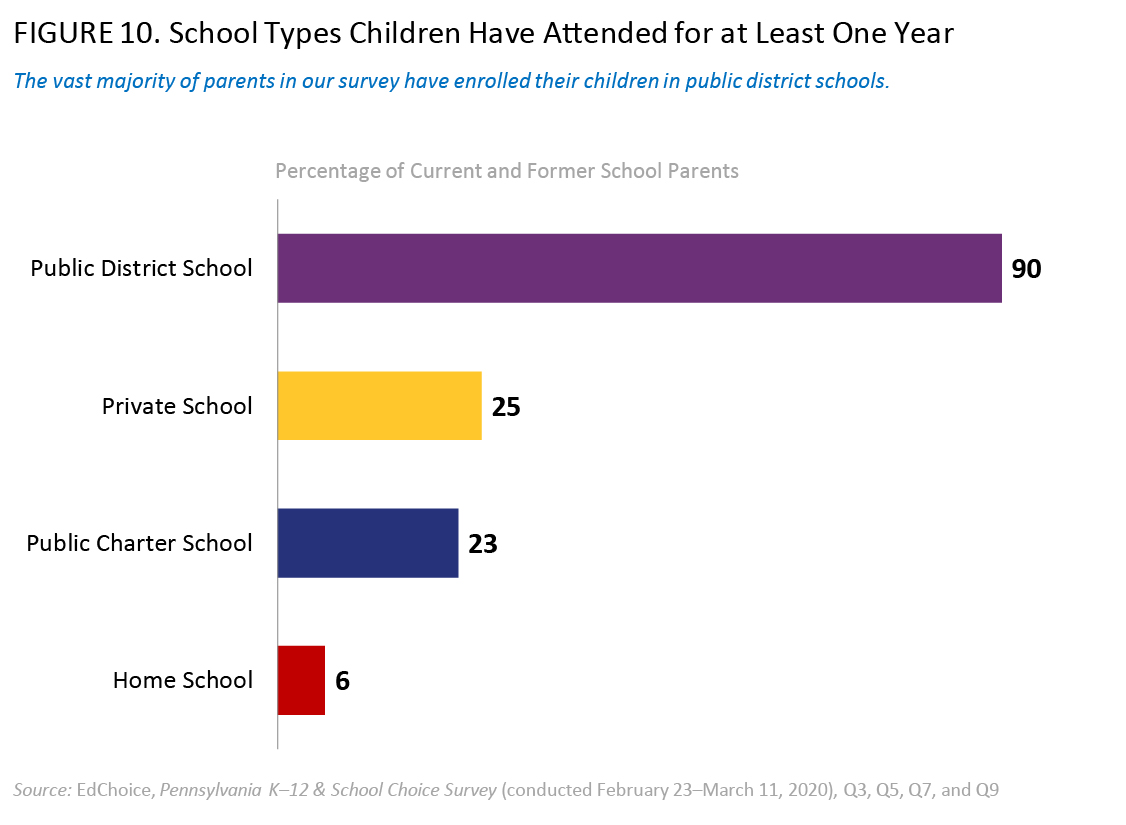
The vast majority of parents’ experiences occur in public district schools, with nine out of 10 parents surveyed (90%) having children who attended at least one year of public school. Figure 10 displays parents’ schooling experiences by type based on survey responses.
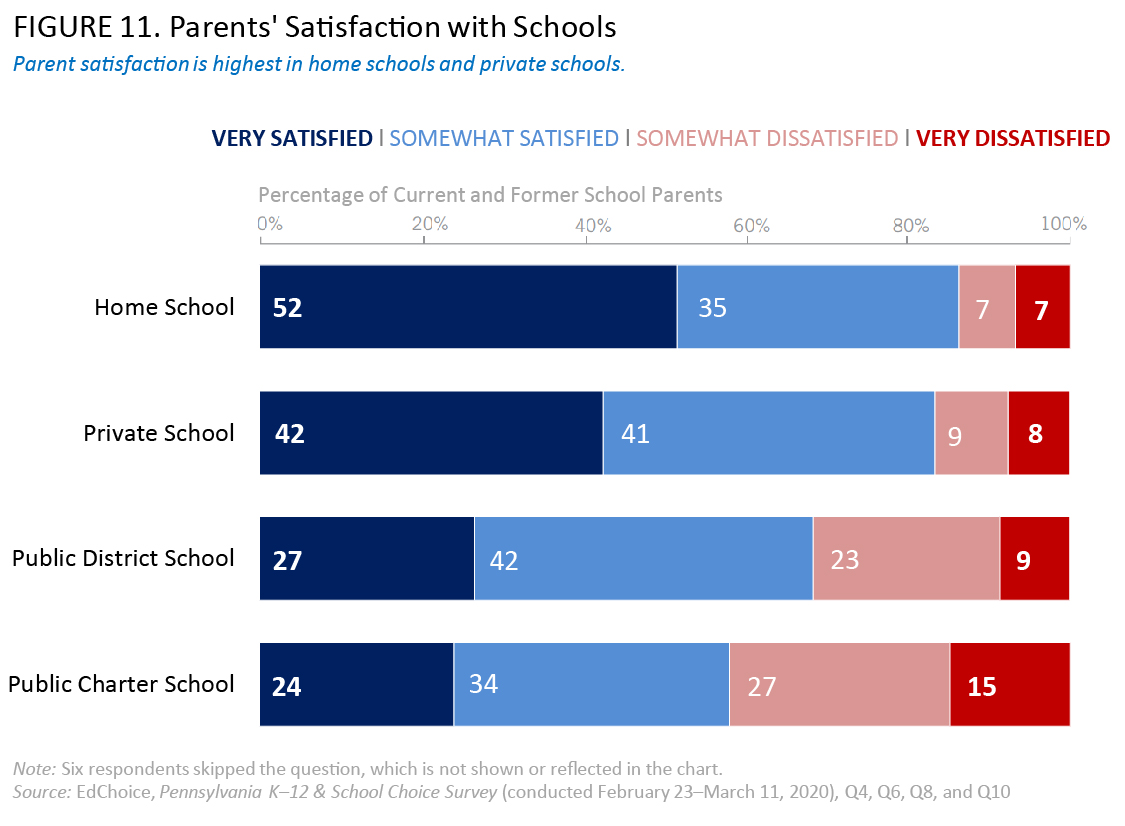
Current and former school parents are more likely to say they have been satisfied than dissatisfied across all types of schools. More than four out of five parents who have homeschooled their children (86%) or sent their children to private school (83%) expressed they were satisfied, the highest levels of satisfaction among the four school types. The home school and private school satisfaction margins (+72 points and +67 points, respectively) were nearly twice the margin observed for district schools (+37 points) and were far greater than the satisfaction margin for charter schools (+16 points). Parents were more likely to say they were “very satisfied” with homeschooling (52%) or private schools (42%) than district schools (27%) or public charter schools (24%).
Grading Local Schools
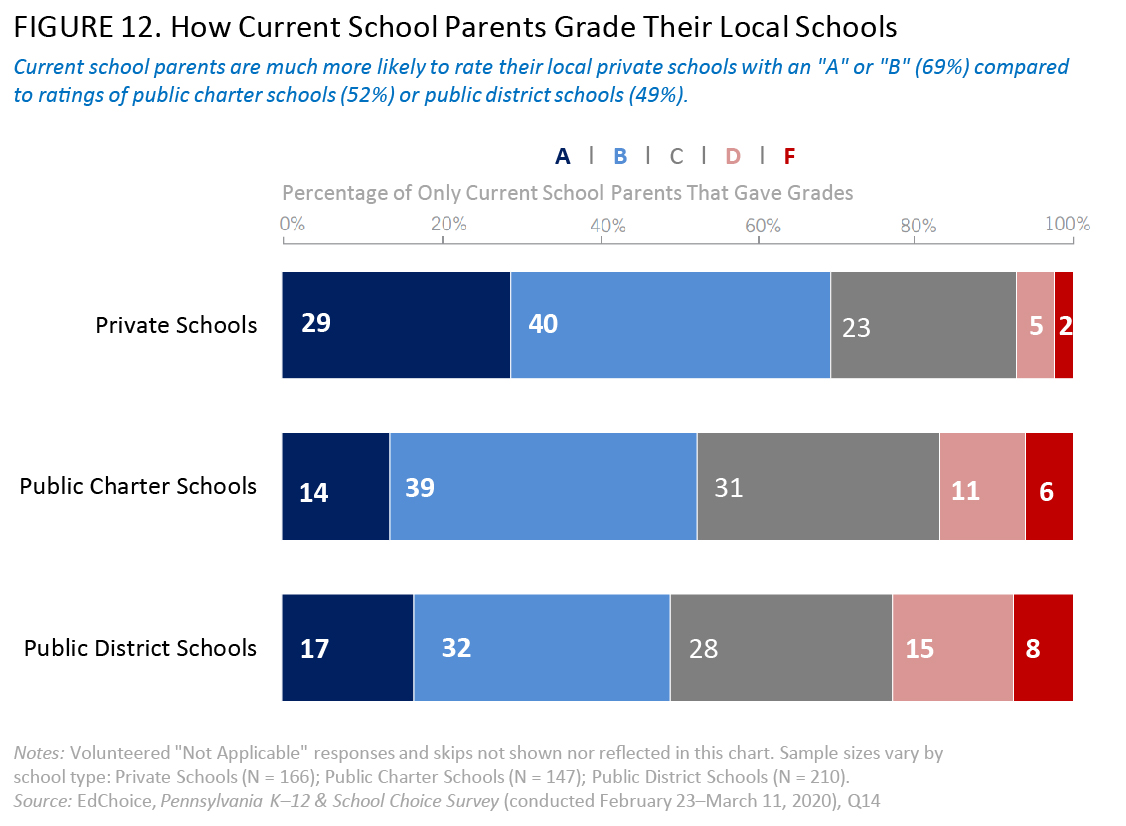
Pennsylvanians are much more likely to give grades of “A” or “B” to private schools in their communities compared with their local public schools. When considering only those respondents with children in school, the local private schools (69% gave an “A” or “B”) fare better than public charter schools (52% gave an “A” or “B”) and regular public schools (49% gave an “A” or “B”). Only 7 percent of respondents give a “D” or “F” grade to private schools; 17 percent gave low grades to public charter schools; and 23 percent assign poor grades to area public district schools.
When considering all responses, we see approximately 60 percent of Pennsylvanians give an “A” or “B” to local private schools; 39 percent give an “A” or “B” to local public charter schools; and 42 percent giving those high grades to regular local public schools. Only 7 percent of respondents give a “D” or “F” grade to private schools; 24 percent give the same low grades to regular public schools; and 13 percent suggest low grades for public charter schools.
It is important to highlight that much higher proportions of respondents do not express any view for private schools (16%) or public charter schools (25%), compared with the proportion that do not grade regular public schools (3%).
School Type Preferences
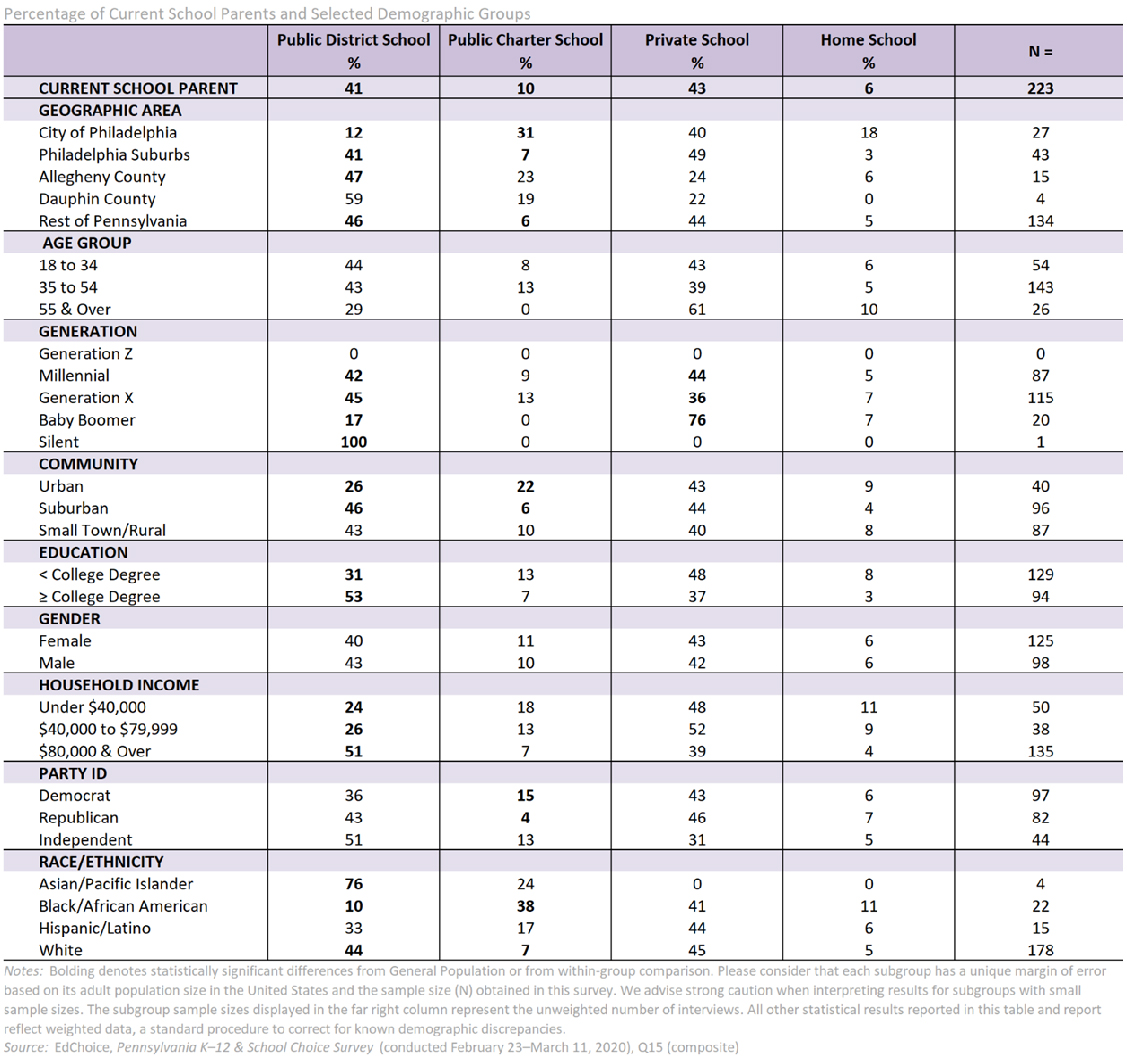
When asked for a preferred school type, more than two out of five Pennsylvania parents would choose a private school (44%) as a first option for their child. Two-fifths of respondents (40%) would select a public district school. Ten percent would choose a public charter school, and about one out of 12 would like to homeschool their child (8%).8
Private preferences signal a glaring disconnect with estimated school enrollment patterns in Pennsylvania. About 79 percent of K–12 students attend public district schools across the state. Roughly 7 percent of students currently go to public charter schools. About 12 percent of students enroll in private or parochial schools, including about 3 percent doing so through the state’s two tax-credit scholarship programs. And it is estimated about 3 percent of the state’s students are homeschooled.9
In a split-sample experiment, interviewers asked a baseline question and an alternate version using a short phrase in addition to the baseline. When inserting the short phrase “… and financial costs and transportation were of no concern,” respondents are more likely to select private school compared to responses to the version without the phrase. The phrase’s effect appeared to increase the likelihood for parents choosing private schools (+5 point increase from baseline to alternate) or public district schools (+1 point increase). The phrasing effect depressed the likelihood of parents to choose a public charter school (-5 point decrease) or home school (-1 point decrease). The inserted language in the alternate version appears to be a clear signal that can increase the attraction toward private schools while decreasing the likelihood to choose a public charter school. Overall, 46 percent of Pennsylvanians said that if financial cost and transportation were of no concern, they would select private schooling to obtain the best education for their child.
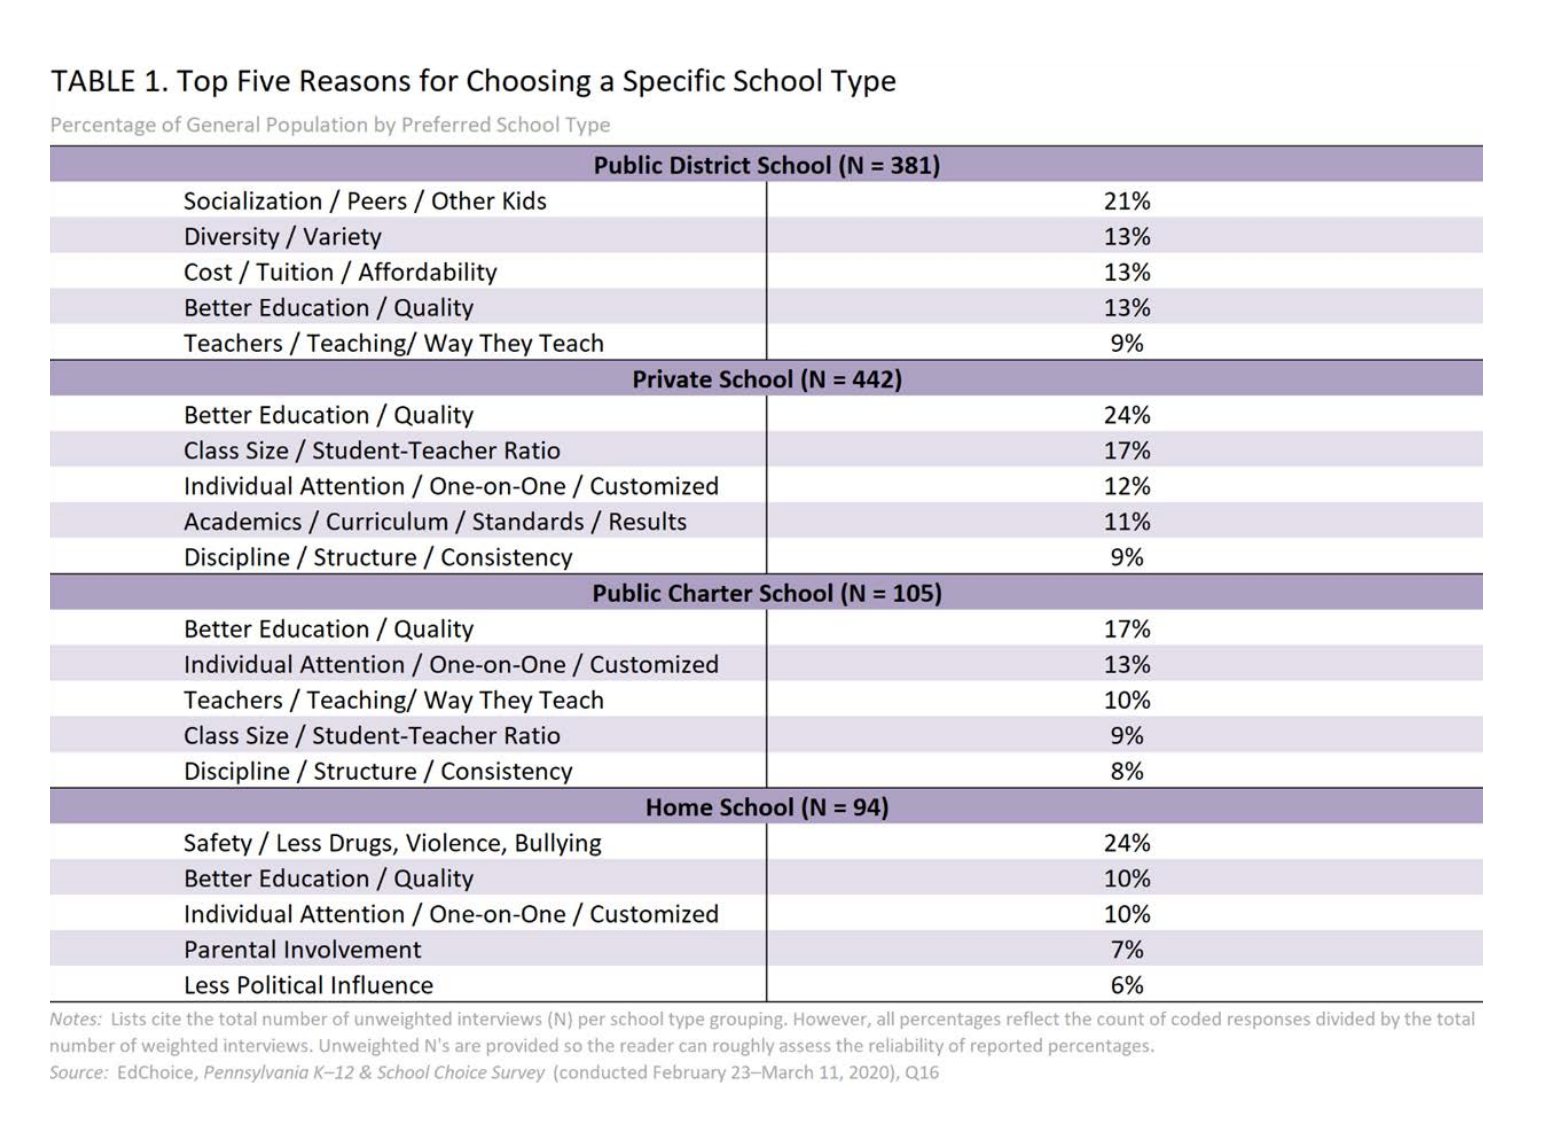
We asked survey respondents a follow-up question to find out the main reason they chose a certain type of school. Respondents choosing private school or public charter school were more likely to prioritize “individual attention/one-on-one/customized” and “better education/quality” than those selecting public district school. Approximately one-third of private school choosers (35%) and charter school choosers (30%) gave those reasons. Respondents that preferred district schools would most frequently say some aspect of “socialization” was a key reason for making their selection. We encourage readers to cautiously interpret these results because sample sizes were relatively small for the respondents that chose charter schools or homeschooling.
Perceived Direction of K–12 Education
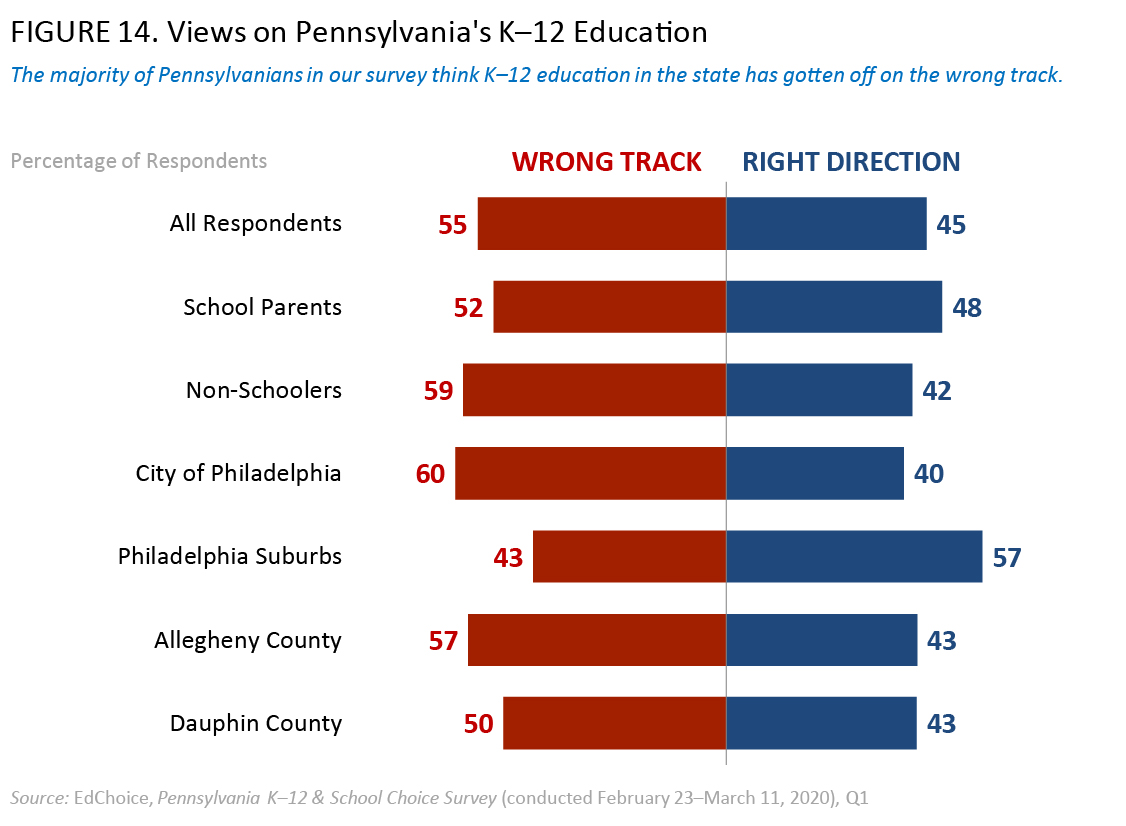
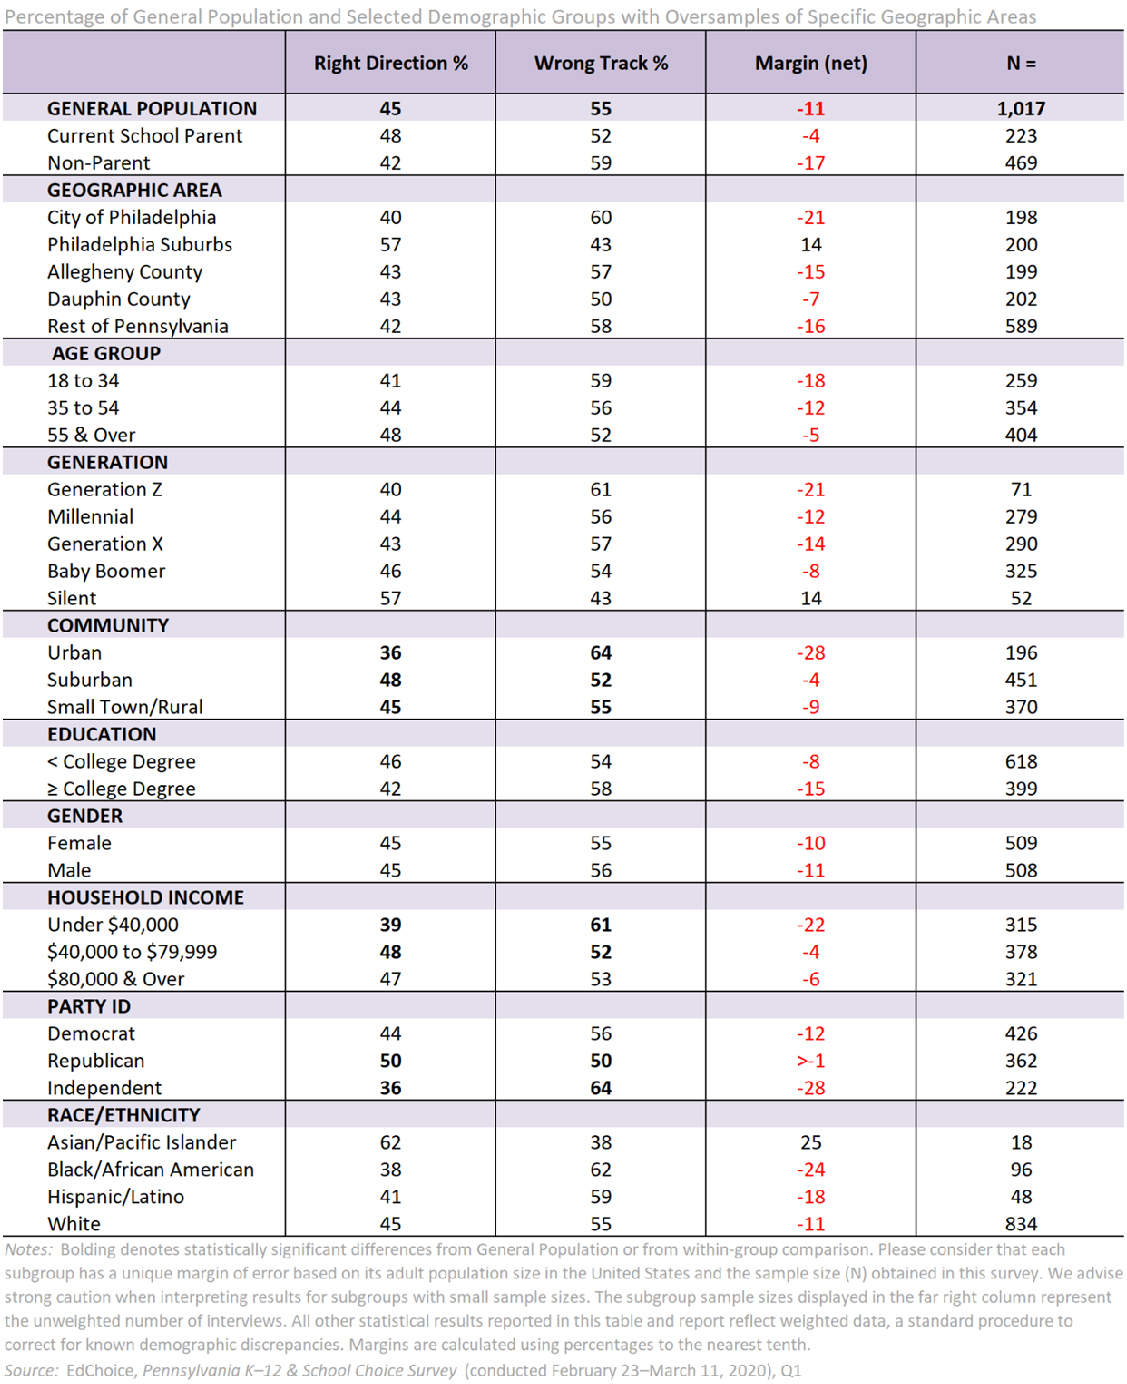
More than half of Pennsylvanians (55%) say they think K–12 education in the state is on the “wrong track,” compared to 45 percent thinking it is going in the “right direction.” On balance, the mood for K–12 education tends to be negative, showcased by a negative margin of -11 points. Residents of the Philadelphia suburbs were the only observed demographic with a robust sample size to have a positive margin (+14 points).
In addition:
- Urbanites (64%) were more likely to say “wrong track” than suburbanites (52%) and small town and rural residents (55%).
- Low-income earners (61%) were more likely to say “wrong track” than middle-income earners (52%).
- Half of Republicans (50%) said “right direction” and were more likely to do so than Democrats (44%) and Independents (36%).
Views on Spending in K–12 Education
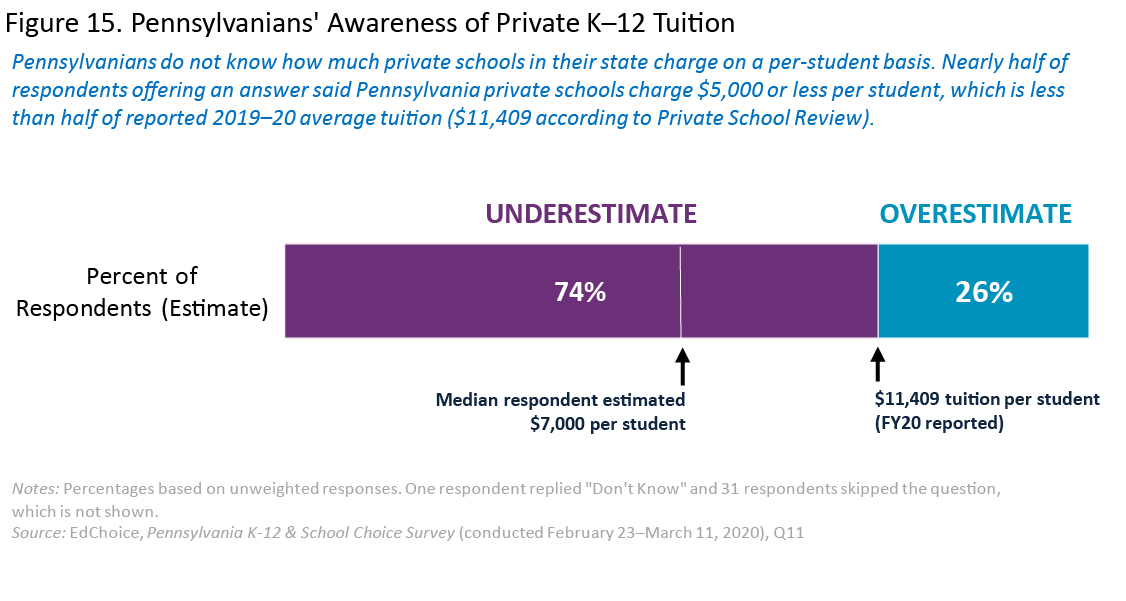
On average, according to Private School Review, Pennsylvania private schools charge approximately $11,409 for tuition per student. Respondents were more likely to underestimate private school tuition (74%) than overestimate it (26%). Responses ranged from $0 to $50,000. The average response was $10,009, while the median response was $7,000. Nearly one-fourth of respondents (22%) provided an estimate of $10,000 or more, while almost half (45%) provided an estimate of $5,000 or less.10
On average, Pennsylvania spends $17,582 on each student in the state’s public schools, based on an expansive spending statistic termed “total expenditures.”11 Respondents were much more likely to underestimate public per-pupil spending (92%) than overestimate it (8%). Responses ranged from $0 to $50,000. The average response was $7,233, while the median response was $5,000. Only five percent of respondents provided an estimate of $10,000 or more, while nearly one-third of respondents (31%) provided an estimate of $2,000 or less.
If instead of “total expenditures” we use “current expenditures” per student ($15,710 in 2017–18)—a more cautious federal government definition for K–12 education spending that does not include capital costs and debt repayment—the proportion of Pennsylvanians likely to underestimate per-pupil spending only changes a single percentage point (91%).12
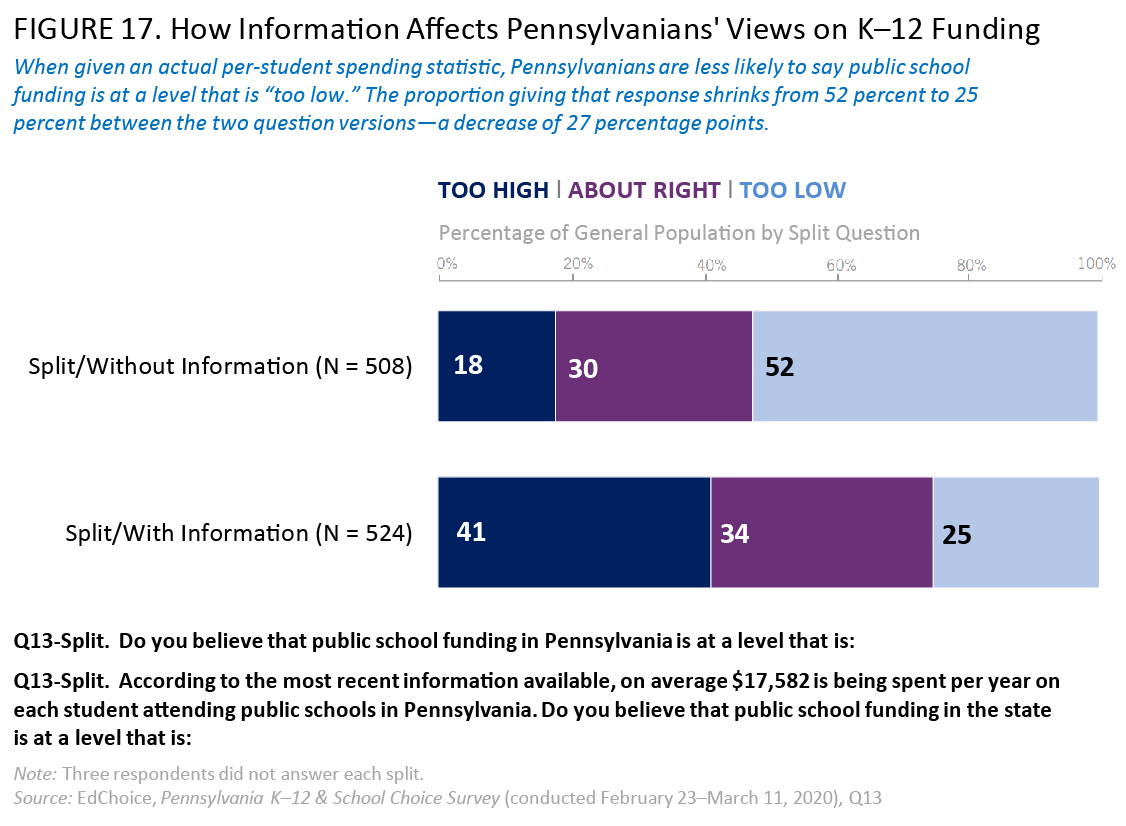
Given an actual per-student spending statistic, Pennsylvanians are much less likely to say public school funding is at a level that is “too low.” In a split-sample experiment, we asked two slightly different questions. On the baseline version, 52 percent of respondents said public school funding was “too low.” However, on the version where we included a statistic for average public per-pupil spending in Pennsylvania ($17,582 in 2017–18; the most recent statistic available when the survey was fielded), the proportion that said spending was “too low” shrank by 27 percentage points to 25 percent.13
Appendix 1: Survey Project & Profile
Title: Pennsylvania K–12 & School Choice Survey
Survey Funder: EdChoice
Survey Data Collection and Quality Control: Braun Research, Inc. (BRI)
Interview Dates: February 23–March 11, 2020
Sample Frames: Pennsylvania Registered Voters (age 18+)
Sampling Method: Online: Non-probability-based Opt-in Panel; Phone: Dual Frame, Probability-based, Random Digit Dial (RDD)
Language(s): English
Interview Method: Mixed Mode
Online, N = 1,270
Live Telephone, N = 137
-
-
-
-
- Landline = 55%
- Cell Phone = 45%
-
-
-
Interview Length: Online: 10.2 minutes (average); Phone: 15.1 minutes (average)
Sample Size and Margin of Error: Total, with Oversamples (N = 1,407): ±2.61 percentage points; Statewide without Oversamples (N = 1,032): ±3.05 percentage points
Response Rate: Online: 37.8%; Phone: 0.9%
Weighting? Yes
Age, County, Gender, Ethnicity, Race, Community Type, Income, Party ID
Oversampling? Yes
Allegheny County (N = 201)
City of Philadelphia (N = 202)
Harrisburg/Dauphin County (N = 203)
Project Contact: Drew Catt, dcatt@edchoice.org
The authors are responsible for overall survey design; question wording and ordering; this report’s analysis, charts, and writing; and any unintentional errors or misrepresentations.
EdChoice is the survey’s sponsor and sole funder at the time of publication.
Appendix 2
Views on Pennsylvania’s Educational Improvement Tax Credit (EITC) Program: Descriptive Version Results
Appendix 3
Views on Pennsylvania’s Opportunity Scholarship Tax Credit (OSTC) Program: Descriptive Version Results
Appendix 4
Views on Tax-Credit Scholarship Program Cap Increase
Appendix 5
Views on Education Scholarship Accounts (ESAs): Descripting Version Results
Appendix 6
Views on Education Scholarship Accounts (ESAs) for Military-Connected Children
Appendix 7
Views on Charter Schools: Descriptive Results
Appendix 8
Current School Parents’ Schooling Preferences by School Type
Appendix 9
Views on Pennsylvania’s Direction in K–12 Education
Acknowledgments
We are extremely grateful to the Pennsylvanians that took the time to respond to the survey online or via phone. We are also grateful to Braun Research, Inc. for administering our survey and for data collection and quality control. We deeply appreciate the work of Michael Davey for making these pages look more professional and Jen Wagner for correcting spelling and grammar mistakes. Any remaining errors in this publication are solely those of the authors.
Additional PDFs
Pennsylvania K 12 & School Choice Survey Screener Questions
Pennsylvania K 12 & School Choice Survey Questionnaire And Topline Results
Pennsylvania K 12 & School Choice Survey Methods And Data Sources
Endnotes
Pennsylvania Department of Education, Expenditure Data 2017-2018 [Data file], accessed January 27, 2020, retrieved from https://www.education.pa.gov/Documents/Teachers-Administrators/School%20Finances/Finances/Summary%20of%20AFR%20Data/AFR%20Data%20Summary%20Level/Finances%20AFR%20Expenditures%202017-2018.xlsx
Authors’ calculations; EdChoice (2020), The ABCs of School Choice: The Comprehensive Guide to Every Private School Choice Program in America, 2020 edition, retrieved from https://www.edchoice.org/wp-content/uploads/2020/01/2020-ABCs-of-School-Choice-WEB-OPTIMIZED-REVISED.pdf
For terminology: We use the label “current school parents” to refer to those respondents who said they have one or more children in preschool through high school. We use the label “former school parents” for respondents who said their children are past high school age. We use the label “non-parents” for respondents without children. For terms regarding age groups: “younger” reflect respondents who are age 18 to 34; “middle-age” are 35 to 54; and “seniors” are 55 and older. Labels pertaining to income groups go as follows: “low-income earners” < $40,000; “middle-income earners” ≥$40,000 and < $80,000; “high-income earners” ≥ $80,000. We adapt the Pew Research Center’s classifications of generational cohorts for this report: Generation Z (1997 or earlier) Millennial (1981–1996); Generation X (1965–1980); Baby Boomer (1946–1964); and Silent Generation (1928–1945). Pew Research Center, Generations and Age [Web page], accessed April 1, 2020, retrieved from http://www.pewresearch.org/topics/generations-and-age
Marc LeBlond (2019, June 5), Thousands of Scholarship Applications Denied, Again [Blog post], retrieved from Commonwealth Foundation website: https://www.commonwealthfoundation.org/policyblog/detail/thousands-of-scholarship-applications-denied-again
EdChoice (2020), What Is An Education Savings Account? [Web page], accessed April 21, 2020, retrieved from https://www.edchoice.org/school-choice/types-of-school-choice/education-savings-account
Center for Research on Education Outcomes (2019), Charter School Performance in Pennsylvania, retrieved from: https://credo.stanford.edu/sites/g/files/sbiybj6481/f/2019_pa_state_report_final_06052019.pdf; Education Commission of the States (2020), Charter Schools: State Profile – Pennsylvania [Web page], accessed April 3, 2020, retrieved from: http://ecs.force.com/mbdata/mbstprofile?Rep=CSP20&st=Pennsylvania
Unless otherwise noted, the results in this section reflect the composite average of split-sample responses of current and former school parents to both splits for question 15.
Authors’ calculations; Andrew D. Catt (2020, April 15), U.S. States Ranked by Educational Choice Share, 2020 [Blog post], retrieved from EdChoice website: https://www.edchoice.org/engage/u-s-states-ranked-by-educational-choice-share-2020
Private School Review, Pennsylvania Private Schools by Tuition Cost [Web page], accessed April 6, 2020, retrieved from: https://www.privateschoolreview.com/tuition-stats/pennsylvania
Pennsylvania Department of Education, Expenditure Data 2017-2018 [Data file], accessed January 27, 2020, retrieved from https://www.education.pa.gov/Documents/Teachers-Administrators/School%20Finances/Finances/Summary%20of%20AFR%20Data/AFR%20Data%20Summary%20Level/Finances%20AFR%20Expenditures%202017-2018.xlsx
Ibid.; “Current Expenditures” data include dollars spent on instruction, instruction-related support services, and other elementary/secondary current expenditures, but exclude expenditures on capital outlay, other programs, and interest on long-term debt. “Total Expenditures” includes the latter categories and sometimes others. Stephen Q. Cornman, Lei Zhou, Malia R. Howell, and Jumaane Young (2020), Revenues and Expenditures for Public Elementary and Secondary Education: FY 17 (NCES 2020-301), retrieved from National Center for Education Statistics website: https://nces.ed.gov/pubs2020/2020301.pdf
U.S. Census Bureau, 2017 Public Elementary-Secondary Education Finance Data: Summary Tables [Data file], accessed January 7, 2020, retrieved from https://www2.census.gov/programs-surveys/school-finances/tables/2017/secondary-education-finance/elsec17_sumtables.xls
